Checkpoints
Calculate trips taken by Yellow taxi in each month of 2015
/ 10
Calculate average speed of Yellow taxi trips in 2015
/ 10
Test whether fields are good inputs to your fare forecasting model
/ 20
Create a BigQuery dataset to store models
/ 10
Create a taxifare model
/ 20
Evaluate classification model performance
/ 10
Predict taxi fare amount
/ 20
Predict Taxi Fare with a BigQuery ML Forecasting Model
- GSP246
- Overview
- Setup and requirements
- Task 1. Explore NYC taxi cab data
- Task 2. Identify an objective
- Task 3. Select features and create your training dataset
- Task 4. Create a BigQuery dataset to store models
- Task 5. Select a BigQuery ML model type and specify options
- Task 6. Evaluate classification model performance
- Task 7. Predict taxi fare amount
- Task 8. Improving the model with Feature Engineering
- Task 9. Test your understanding
- Task 10. Other datasets to explore
- Congratulations!
GSP246

Overview
BigQuery is Google's fully managed, NoOps, low cost analytics database. With BigQuery you can query terabytes and terabytes of data without having any infrastructure to manage, or needing a database administrator.
BigQuery ML provides data analysts the ability to create, train, evaluate, and predict with machine learning models with minimal coding.
In this lab, you work with millions of New York City yellow taxi cab trips available in a BigQuery Public Dataset. You use this data to create a machine learning model inside of BigQuery to predict the fare of the cab ride given your model inputs and evaluate the performance of your model and make predictions with it.
What you'll learn
In this lab, you learn to perform the following tasks:
- Use BigQuery to find public datasets
- Query and explore the public taxi cab dataset
- Create a training and evaluation dataset to be used for batch prediction
- Create a forecasting (linear regression) model in BigQuery ML
- Evaluate the performance of your machine learning model
Setup and requirements
Before you click the Start Lab button
Read these instructions. Labs are timed and you cannot pause them. The timer, which starts when you click Start Lab, shows how long Google Cloud resources will be made available to you.
This hands-on lab lets you do the lab activities yourself in a real cloud environment, not in a simulation or demo environment. It does so by giving you new, temporary credentials that you use to sign in and access Google Cloud for the duration of the lab.
To complete this lab, you need:
- Access to a standard internet browser (Chrome browser recommended).
- Time to complete the lab---remember, once you start, you cannot pause a lab.
How to start your lab and sign in to the Google Cloud console
-
Click the Start Lab button. If you need to pay for the lab, a pop-up opens for you to select your payment method. On the left is the Lab Details panel with the following:
- The Open Google Cloud console button
- Time remaining
- The temporary credentials that you must use for this lab
- Other information, if needed, to step through this lab
-
Click Open Google Cloud console (or right-click and select Open Link in Incognito Window if you are running the Chrome browser).
The lab spins up resources, and then opens another tab that shows the Sign in page.
Tip: Arrange the tabs in separate windows, side-by-side.
Note: If you see the Choose an account dialog, click Use Another Account. -
If necessary, copy the Username below and paste it into the Sign in dialog.
{{{user_0.username | "Username"}}} You can also find the Username in the Lab Details panel.
-
Click Next.
-
Copy the Password below and paste it into the Welcome dialog.
{{{user_0.password | "Password"}}} You can also find the Password in the Lab Details panel.
-
Click Next.
Important: You must use the credentials the lab provides you. Do not use your Google Cloud account credentials. Note: Using your own Google Cloud account for this lab may incur extra charges. -
Click through the subsequent pages:
- Accept the terms and conditions.
- Do not add recovery options or two-factor authentication (because this is a temporary account).
- Do not sign up for free trials.
After a few moments, the Google Cloud console opens in this tab.

Open the BigQuery console
- In the Google Cloud Console, select Navigation menu > BigQuery.
The Welcome to BigQuery in the Cloud Console message box opens. This message box provides a link to the quickstart guide and the release notes.
- Click Done.
The BigQuery console opens.
Task 1. Explore NYC taxi cab data
Question: How many trips did Yellow taxis take each month in 2015?
- Copy and paste the following SQL code into the query EDITOR:
- Then click Run.
You should receive the following result:
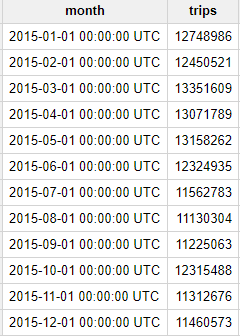
As we see, every month in 2015 had over 10 million NYC taxi trips—no small amount!
Test completed task
Click Check my progress to verify your performed task. If you have completed the task successfully, you will be granted with an assessment score.
Question: What was the average speed of Yellow taxi trips in 2015?
- Replace the previous query with the following and then click Run:
You should receive the following result:
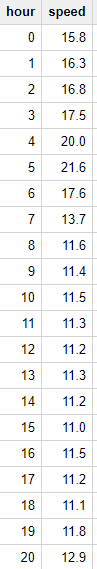
During the day, the average speed is around 11-12 MPH; but at 5:00 AM the average speed almost doubles to 21 MPH. Intuitively this makes sense since there is likely less traffic on the road at 5:00 AM.
Test completed task
Click Check my progress to verify your performed task. If you have completed the task successfully, you will be granted with an assessment score.
Task 2. Identify an objective
You will now create a machine learning model in BigQuery to predict the price of a cab ride in New York City given the historical dataset of trips and trip data. Predicting the fare before the ride could be very useful for trip planning for both the rider and the taxi agency.
Task 3. Select features and create your training dataset
The New York City Yellow Cab dataset is a public dataset provided by the city and has been loaded into BigQuery for your exploration.
Browse the complete list of fields and then preview the dataset to find useful features that will help a machine learning model understand the relationship between data about historical cab rides and the price of the fare.
Your team decides to test whether these below fields are good inputs to your fare forecasting model:
- Tolls Amount
- Fare Amount
- Hour of Day
- Pick up address
- Drop off address
- Number of passengers
- Replace the query with the following:
Note a few things about the query:
- The main part of the query is at the bottom (
SELECT * from taxitrips). -
taxitripsdoes the bulk of the extraction for the NYC dataset, with theSELECTcontaining your training features and label. - The
WHEREremoves data that you don't want to train on. - The
WHEREalso includes a sampling clause to pick up only 1/1000th of the data. - Define a variable called
TRAINso that you can quickly build an independentEVALset.
- Now that you have a better understanding of this query's purpose, click Run.
You should receive a similar result:
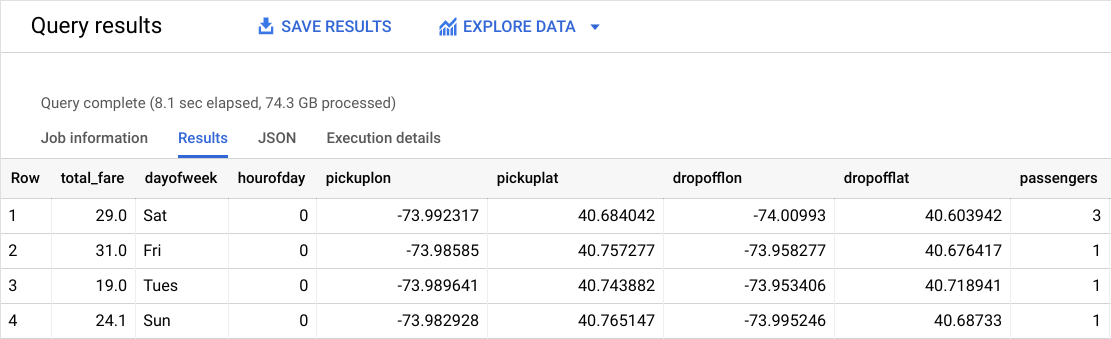
What is the label (correct answer)?
total_fare is the label (what you will be predicting). You created this field out of tolls_amount and fare_amount, so you could ignore customer tips as part of the model as they are discretionary.
Test completed task
Click Check my progress to verify your performed task. If you have completed the task successfully, you will be granted with an assessment score.
Task 4. Create a BigQuery dataset to store models
In this section, you will create a new BigQuery dataset which will store your ML models.
-
In the left-hand Explorer panel, click on the View actions icon next to your Project ID and then click Create dataset.
-
In the Create Dataset dialog, enter in the following:
- For Dataset ID, type taxi.
- Select us(multiple regions in United States) as the Location type.
- Leave the other values at their defaults.
- Then click Create dataset.
Test completed task
Click Check my progress to verify your performed task. If you have completed the task successfully, you will be granted with an assessment score.
Task 5. Select a BigQuery ML model type and specify options
Now that you have your initial features selected, you are now ready to create your first ML model in BigQuery.
There are several model types to choose from:
- Forecasting numeric values like next month's sales with Linear Regression (linear_reg).
- Binary or Multiclass Classification like spam or not spam email by using Logistic Regression (logistic_reg).
- k-Means Clustering for when you want unsupervised learning for exploration (kmeans).
- Enter the following query to create a model and specify model options.
-
Next, click Run to train your model.
-
Wait for the model to train (5 - 10 minutes).
After your model is trained, you will see the message "This statement will create a new model named qwiklabs-gcp-03-xxxxxxxx:taxi.taxifare_model." which indicates that your model has been successfully trained.
- Look inside your taxi dataset and confirm taxifare_model now appears.
Next, you will evaluate the performance of the model against new unseen evaluation data.
Test completed task
Click Check my progress to verify your performed task. If you have completed the task successfully, you will be granted with an assessment score.
Task 6. Evaluate classification model performance
Select your performance criteria
For linear regression models you want to use a loss metric like Root Mean Square Error (RMSE). You want to keep training and improving the model until it has the lowest RMSE.
In BQML, mean_squared_error is a queryable field when evaluating your trained ML model. Add a SQRT() to get RMSE.
Now that training is complete, you can evaluate how well the model performs with this query using ML.EVALUATE.
- Copy and paste the following into the query EDITOR and click Run:
You are now evaluating the model against a different set of taxi cab trips with your params.EVAL filter.
- After the model runs, review your model results (your model RMSE value will vary slightly).
|
Row |
rmse |
|
1 |
9.477056435999074 |
After evaluating your model you get a RMSE of 9.47. Since we took the Root of the Mean Squared Error (RMSE) the 9.47 error can be evaluated in the same units as the total_fare so it's +-$9.47.
Knowing whether or not this loss metric is acceptable to productionalize your model is entirely dependent on your benchmark criteria, which is set before model training begins. Benchmarking is establishing a minimum level of model performance and accuracy that is acceptable.
Test completed task
Click Check my progress to verify your performed task. If you have completed the task successfully, you will be granted with an assessment score.
Task 7. Predict taxi fare amount
Next, write a query to use your new model to make predictions.
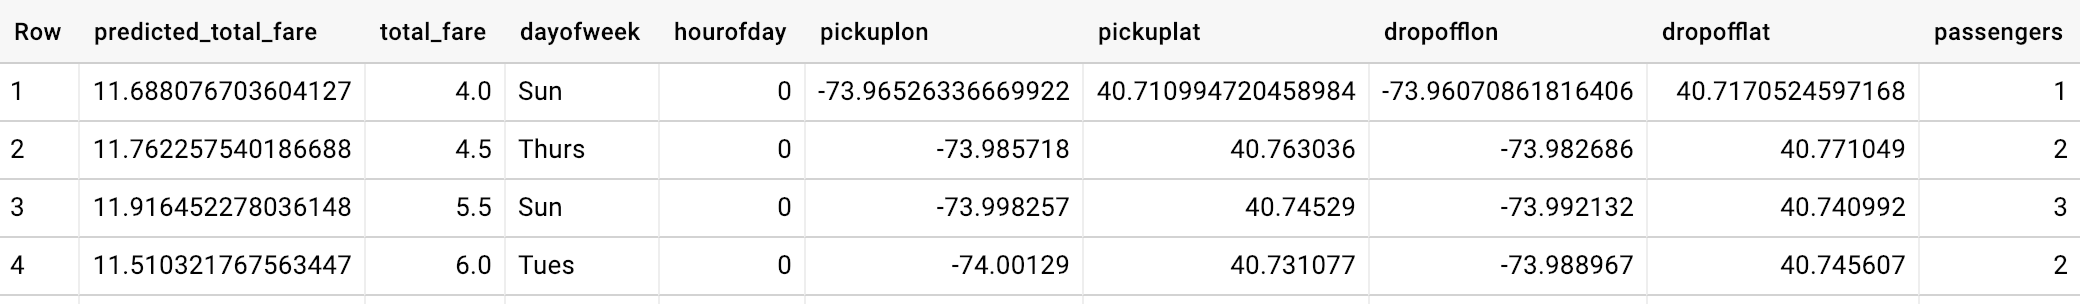
- Copy and paste the following into the query EDITOR and click Run:
Now you will see the model's predictions for taxi fares alongside the actual fares and other features for those rides. Your results should look similar to those below:
Test completed task
Click Check my progress to verify your performed task. If you have completed the task successfully, you will be granted with an assessment score.
Task 8. Improving the model with Feature Engineering
Building Machine Learning models is an iterative process. Once we have evaluated the performance of our initial model, we often go back and prune our features and rows to see if we can get an even better model.
Filtering the training dataset
Now view the common statistics for taxi cab fares.
- Copy and paste the following into the query EDITOR and click Run:
You should receive a similar output:
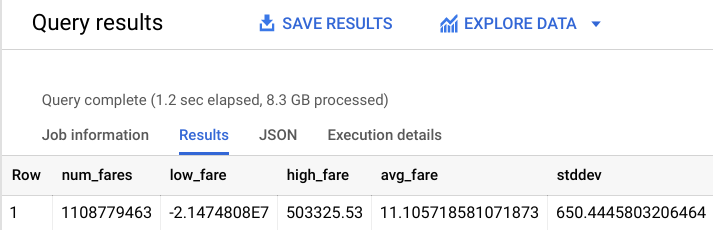
As you can see, there are some strange outliers in our dataset (negative fares or fares over $50,000). Apply some of our subject matter expertise to help the model avoid learning on strange outliers.
Limit the data to only fares between $$6 and $$200.
- Copy and paste the following into the query EDITOR and click Run:
You should receive a similar output:
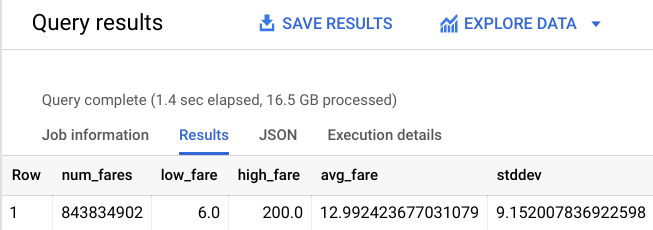
That's a little bit better. While you're at it, limit the distance traveled so you're really focusing on New York City.
- Copy and paste the following into the query EDITOR and click Run:
You should receive a similar output:
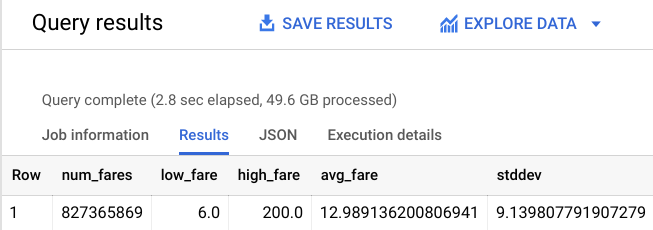
You still have a large training dataset of over 800 million rides for our new model to learn from. Re-train the model with these new constraints and see how well it performs.
Retraining the model
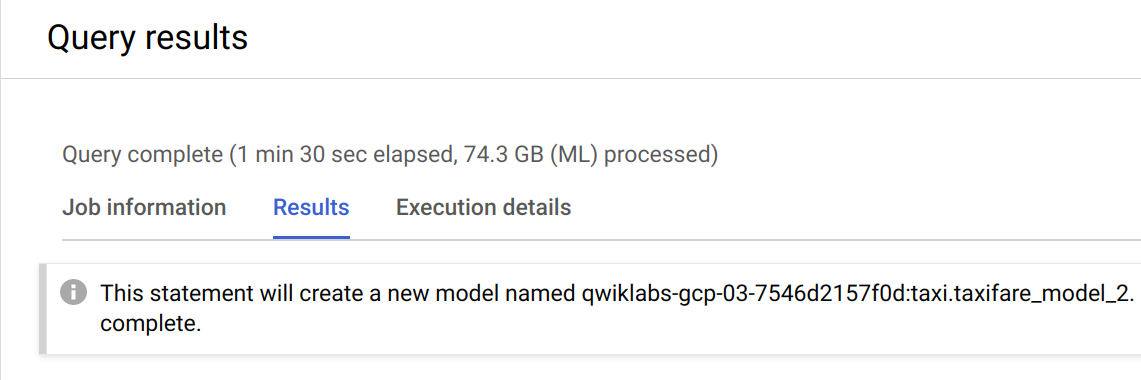
Call the new model taxi.taxifare_model_2 and retrain the linear regression model to predict total fare. You'll note that you've also added a few calculated features for the Euclidean distance (straight line) between the pick up and drop off.
- Copy and paste the following into the query EDITOR and click Run:
It may take a couple minutes to retrain the model. You can move onto the next step when you receive the following message in the Console:
Evaluate the new model
Now that the linear regression model has been optimized, evaluate the dataset with it and see how it performs.
- Copy and paste the following into the query EDITOR and click Run:
You should receive a similar output:
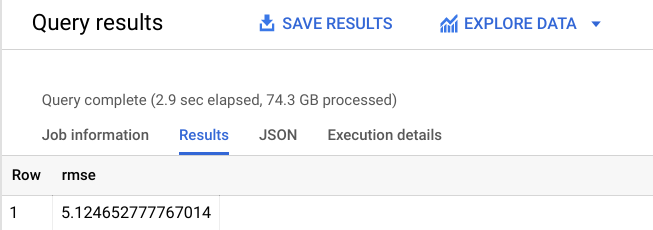
As you see, you've gotten the RMSE down to: +-$$5.12 which is significantly better than +-$$9.47 for your first model.
Since RMSE defines the standard deviation of prediction errors, we see that the retrained linear regression made our model a lot more accurate.
Task 9. Test your understanding
Below are multiple choice questions to reinforce your understanding of this lab's concepts. Answer them to the best of your abilities.
Task 10. Other datasets to explore
You can use the bigquery-public-data project if you want to explore modeling on other datasets like forecasting fares for Chicago taxi trips.
-
To open the bigquery-public-data dataset, click +Add > Star a project by name > Enter Project Name, then write the
bigquery-public-dataname. -
Click Star.
The bigquery-public-data project is listed in the Explorer section.
Congratulations!
You've successfully built a machine learning model in BigQuery to forecast taxi cab fare for New York City cabs.
Next steps / Learn more
- To learn more about BiqQuery ML, review the BigQuery ML documentation.
- To learn more about managing BigQuery ML models in Vertex AI, review the documentation on registering BigQuery ML models with Model Registry.
Google Cloud training and certification
...helps you make the most of Google Cloud technologies. Our classes include technical skills and best practices to help you get up to speed quickly and continue your learning journey. We offer fundamental to advanced level training, with on-demand, live, and virtual options to suit your busy schedule. Certifications help you validate and prove your skill and expertise in Google Cloud technologies.
Manual Last Updated February 07, 2024
Lab Last Tested August 24, 2023
Copyright 2024 Google LLC All rights reserved. Google and the Google logo are trademarks of Google LLC. All other company and product names may be trademarks of the respective companies with which they are associated.