체크포인트
Create new dimensions
/ 30
Create the measures
/ 40
Create the advanced measures
/ 30
Creating Measures and Dimensions Using LookML
GSP890

Overview
Looker is a modern data platform in Google Cloud that lets you analyze and visualize your data interactively. You can use Looker to do in-depth data analysis, integrate insights across different data sources, build actionable data-driven workflows, and create custom data applications.
In Looker, dimensions are unique attributes of the data that help you to describe data. For example, the city and elevation of an airport may be different dimensions within an airport dataset. Measures are aggregations of one or more dimensions (or unique attributes of the data) such as a count or average. Measures let you calculate your Key Performance Indicators (KPIs) and help your business users analyze data using different aggregated attributes.
In this lab, you learn how to create different types of dimensions and measures in LookML as a Looker developer. You also learn how to modify models of Explores, which are data views that serve as the foundation for self-service exploration by the business users in Looker.
For this lab, a project called qwiklabs-ecommerce has been created for you in LookML. This project is based on a mock e-commerce dataset that will enable you to create business KPIs using dimensions and measures created using LookML. You can learn more about LookML modeling in the Looker documentation.
Objectives
In this lab, you will learn how to:
- Modify an existing LookML project (
qwiklabs-ecommerce) published by a Looker admin. - Create different types of dimensions and measures in LookML to address your business users' questions.
- Test your LookML changes in development mode.
- Use the Explore interface to view the dimensions and measures that you have created in the modified LookML project.
Setup and requirements
Before you click the Start Lab button
Read these instructions. Labs are timed and you cannot pause them. The timer, which starts when you click Start Lab, shows how long Google Cloud resources will be made available to you.
This hands-on lab lets you do the lab activities yourself in a real cloud environment, not in a simulation or demo environment. It does so by giving you new, temporary credentials that you use to sign in and access Google Cloud for the duration of the lab.
To complete this lab, you need:
- Access to a standard internet browser (Chrome browser recommended).
- Time to complete the lab---remember, once you start, you cannot pause a lab.
How to start your lab and sign in to Looker
-
When ready, click
.
A new panel will appear with the temporary credentials that you must use for this lab.
If you need to pay for the lab, a pop-up will open for you to select your payment method.
-
Note your lab credentials in the left pane. You will use them to sign in to the Looker instance for this lab.
Note: If you use other credentials, you will get errors or incur charges. -
Click Open Looker.
-
Enter the provided Username and Password in the Email and Password fields.
Important: You must use the credentials from the Connection Details panel on this page. Do not use your Google Cloud Skills Boost credentials. If you have your own Looker account, do not use it for this lab. -
Click Log In.
After a successful login, you will see the Looker instance for this lab.
Task 1. Creating dimensions
In Looker, a dimension is a group-able field and can be used to filter query results. It can be:
- An attribute, which has a direct association to a column in an underlying table
- A fact or numerical value
- A derived value, computed based on the values of other fields in a single row
For example, dimensions for a Products view might include product name, product model, product color, product price, product created date, and product end-of-life date.
Dimensions let you create buckets of data points to analyze your KPIs using different attributes. You can create different types of dimensions like time, numeric, yesno and string to slice and dice your data.
Create a new dimension for age group tiers
In this section, you will create a new dimension named age_tier based off of the age dimension. This dimension will list ranges of ages. You will do this by adding a dimension that groups individual ages into the following age group tiers: 18, 25, 35, 45, 55, 65, 75, 90.
- First, on the bottom left of the Looker User Interface, click the toggle button to enter Development mode.

-
Click the Develop tab and then select the
qwiklabs-ecommerceLookML project. -
Once you are in the
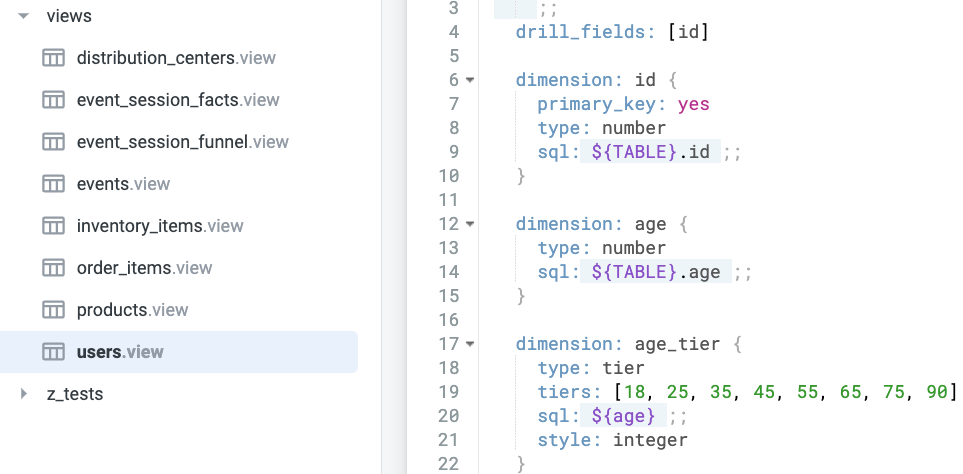
qwiklabs-ecommerceproject, click the arrow next to views to see a list of view names. -
Click
users.view. -
In
users.view, locate the dimension for age. Your file should resemble the following:
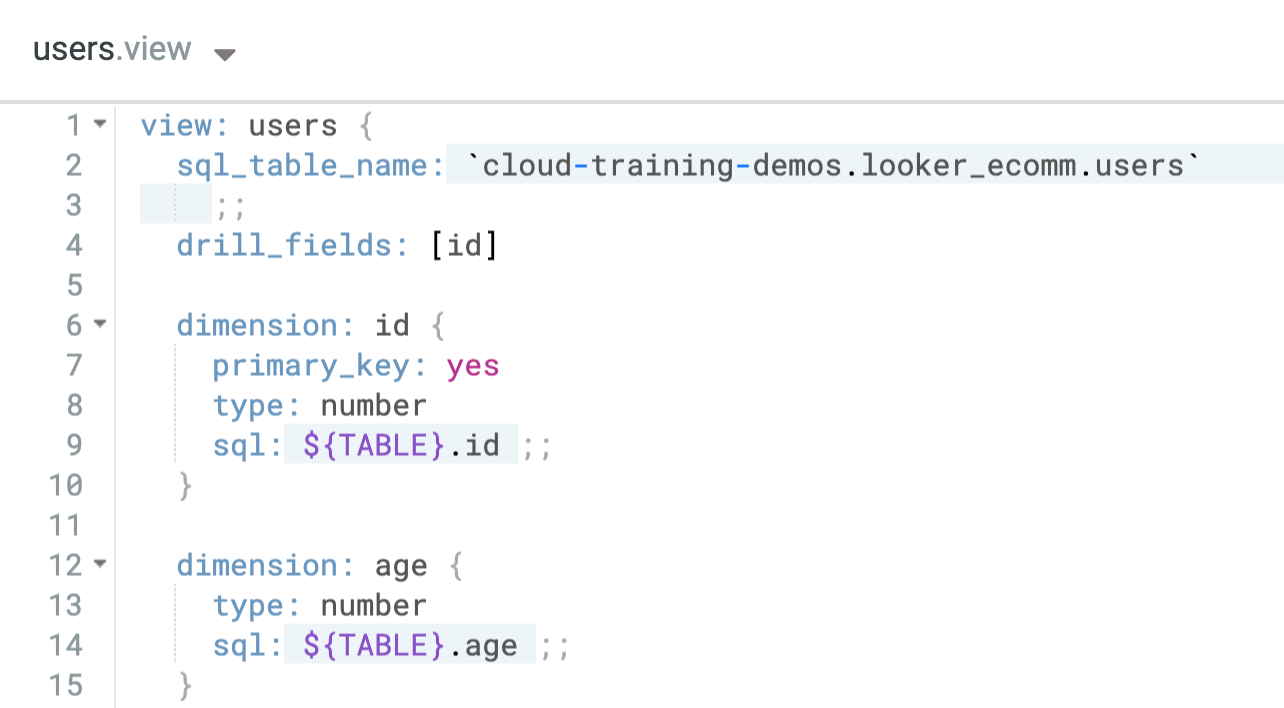
Dimension fields, such as age correspond to your underlying database table, or computed values based on other dimensions.
The editor gives you suggestions as you type, but if you get stuck or need to see a list of different parameters and their attributes, you can always refer to the Quick Help menu on the right-hand side of the IDE.
- On a new line under the dimension for age, start by defining a new dimension for age_tier using the following code:
- Next, you will add the dimension type. This dimension type is
tier, so you'll add that here:
- Next, you will add the specific tiers for the dimension. In this case, you will group the tiers first by 18 and younger, then by increments of 10 years:
- Next, define the style parameter. This parameter is specific to the tier type dimension and changes the way tiers appear in the UI. In this case, you want the style to be
integer:
- Lastly, you'll add the SQL parameter. The SQL parameter tells Looker how to write the SQL for queries users run. For this dimension, you're telling the SQL parameter to pull from the pre-existing age field:
Your file should now resemble the following:
Now that you finished adding a new dimension, you can test to make sure it's working properly.
-
Click Save Changes and then click the Validate LookML button on the top right of the IDE to run a LookML code validation.
-
You can quickly go to the Explore by clicking the caret next to the file title at the top of the IDE and then selecting Explore Order Items.
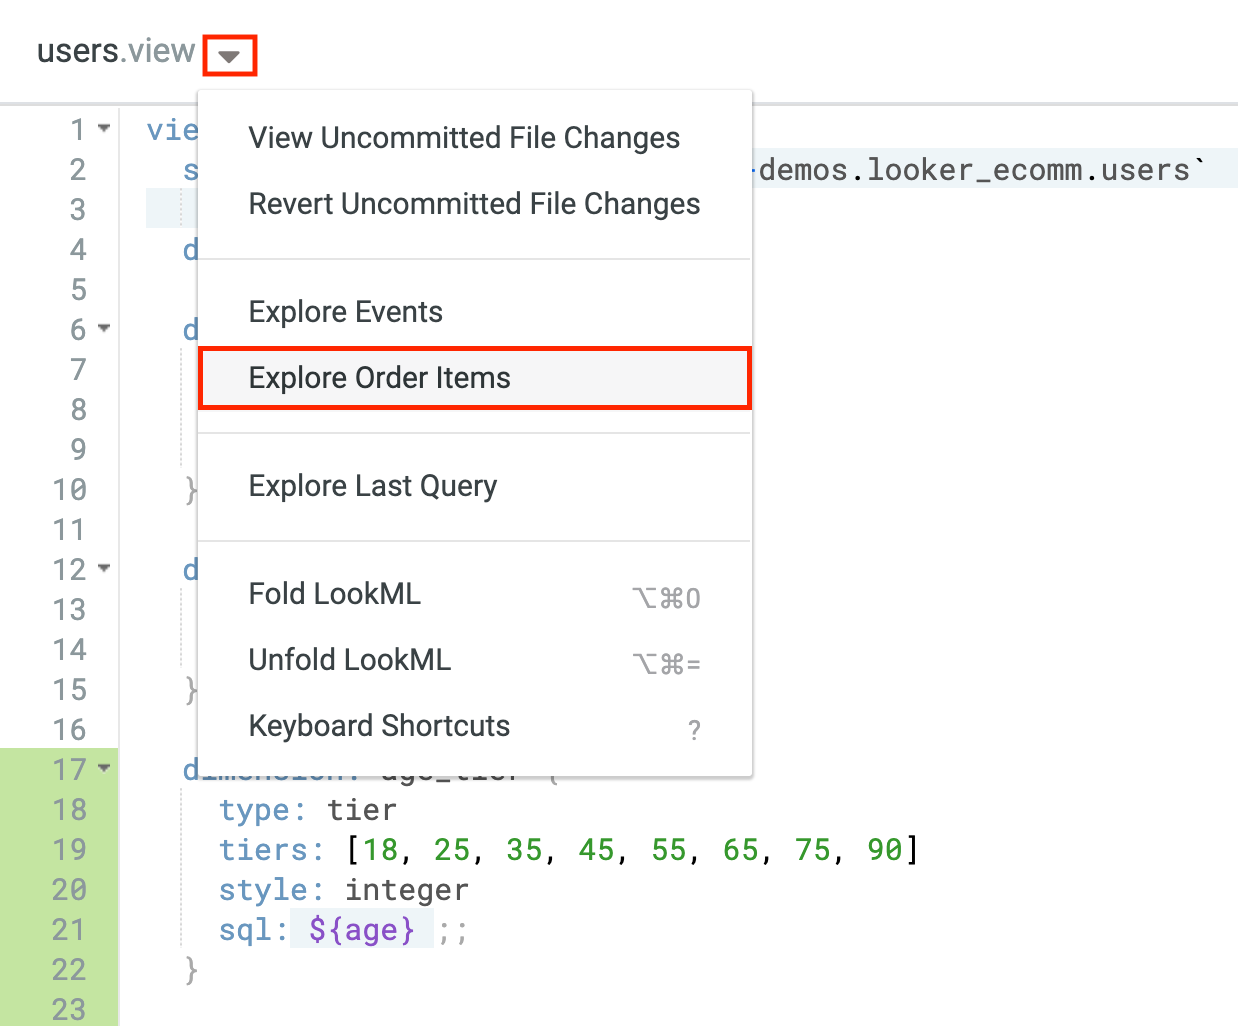
This file menu will only show views that have an Explore defined in the LookML.
-
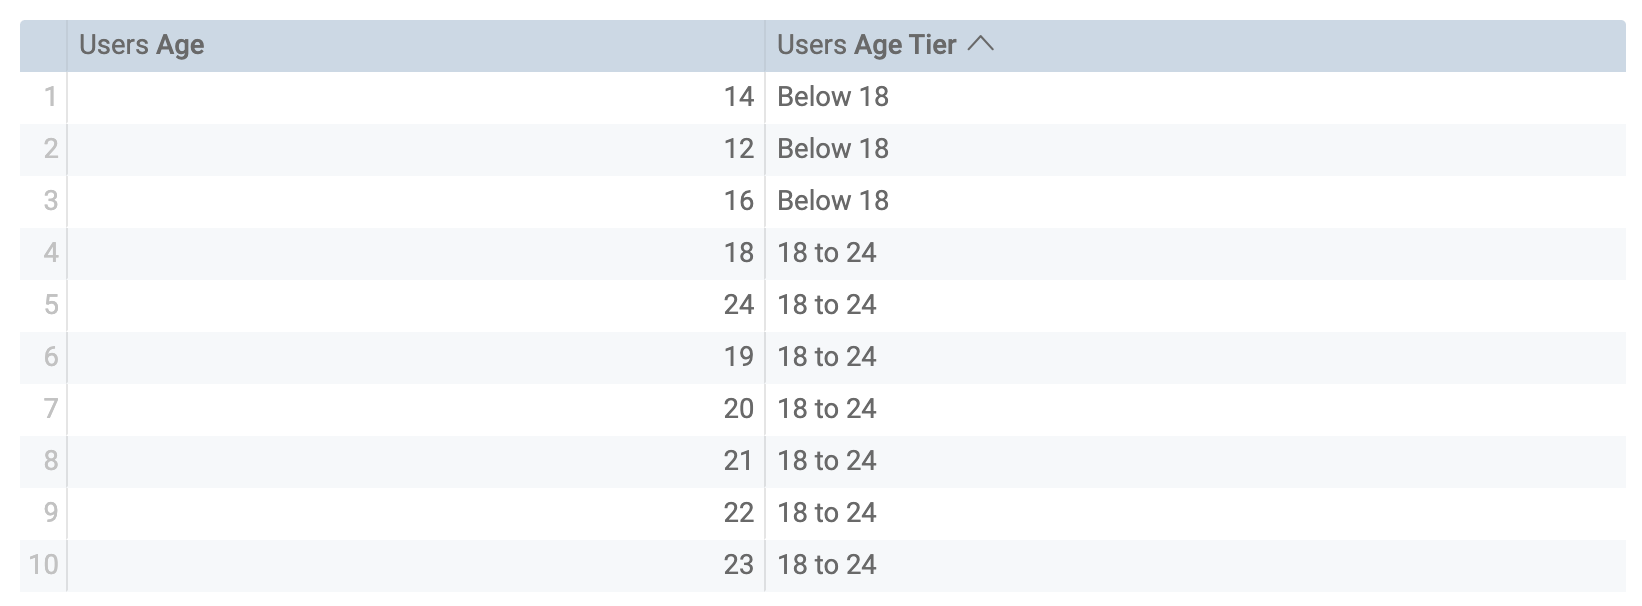
Next, navigate to your new dimension under Users > Dimensions > Age Tier.
-
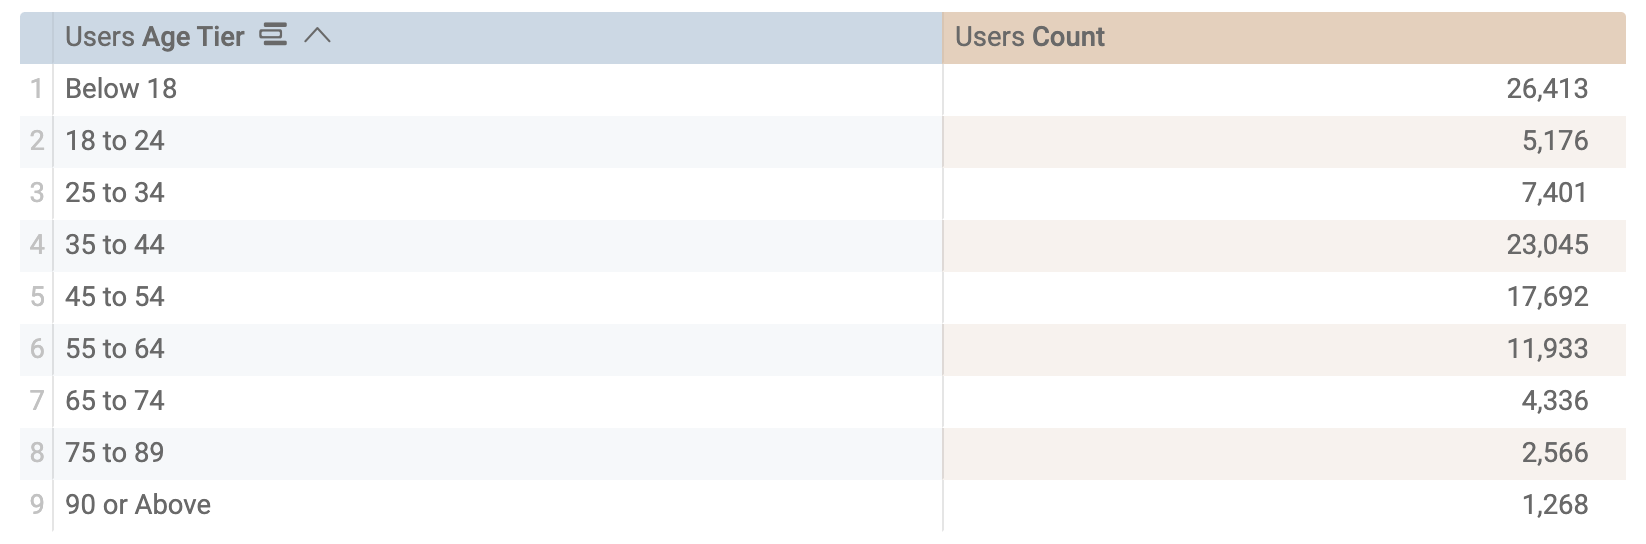
Add the Age and the Age Tier dimensions and click Run. You can see that each age falls into the correct tier:
- Now remove the Age dimension and add the Count measure and hit Run again. The results are showing what you want. Looker has counted the different ages and grouped them into the appropriate tiers. Success!
Create a new dimension for email source
In this section, you will create a new dimension named is_email_source based off of the traffic_source dimension. This dimension will determine whether the traffic source that brought in a given user was via email.
-
Navigate back to the
qwiklabs-ecommerceproject and openusers.viewfile. -
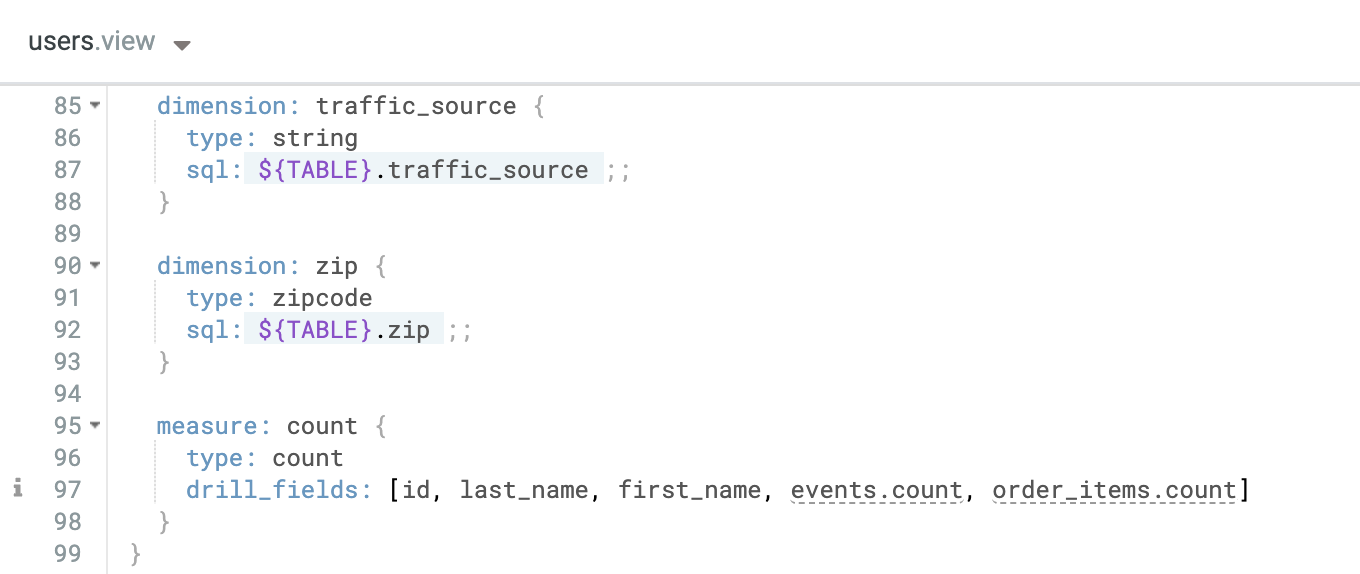
Locate the dimension for traffic_source. Your file should resemble the following:
- On a new line under the dimension for traffic source, start by defining a new dimension for is_email_source using the following code:
- Next, add the type parameter. Since this is a boolean categorization, you will use the
yesnotype:
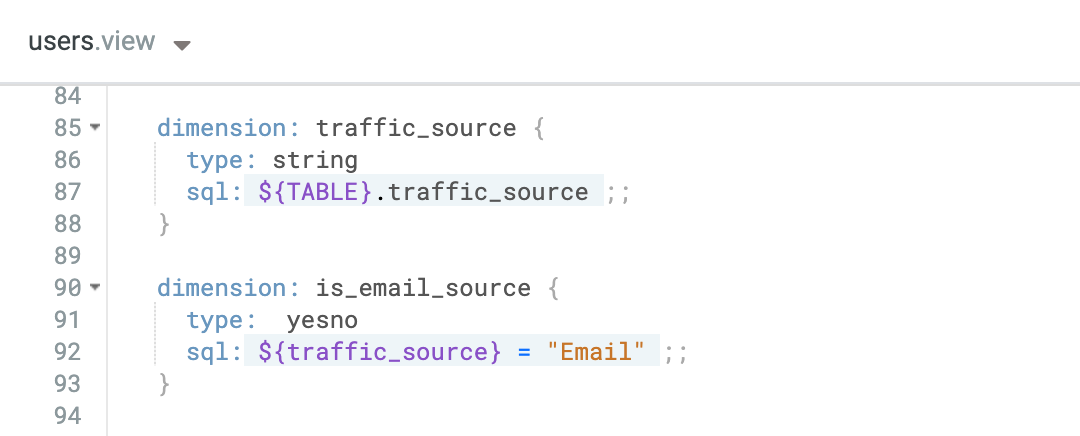
-
Lastly, add the SQL parameter. For this dimension, you're telling the SQL parameter to pull from the pre-existing traffic_source field where the value equals "Email".
-
Be sure to use double quotation marks (
"") when defining "Email" to ensure accurate syntax:
Your file should now resemble the following:
Now that you finished adding a new dimension, you can test to make sure it's working properly.
-
Click Save Changes and then click the Validate LookML button on the top right of the IDE to run a LookML code validation.
-
Click the caret next to the file title at the top of the IDE and then select Explore Order Items:
-
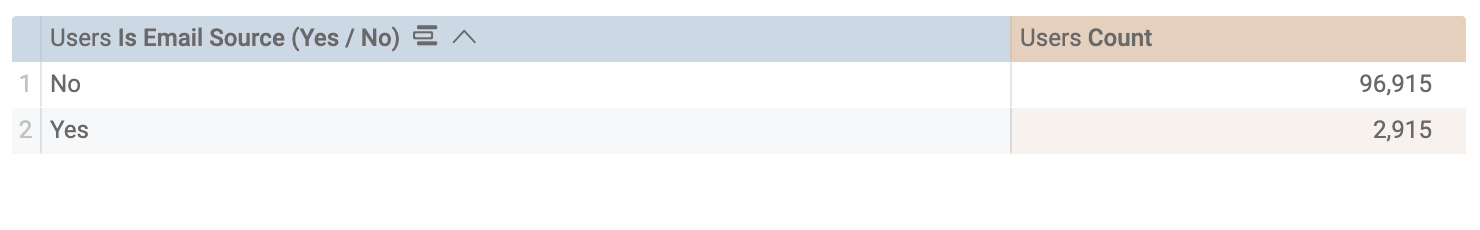
Next, navigate to your new dimension under Users > Dimensions > Is Email Source (Yes / No).
-
Add the Is Email Source dimension and the Count measure and click Run. The results are showing the amount of users that were brought in via email or not. Success!
Create a new dimension for shipping days
In this section, you will create a new dimension named shipping days that calculates the number of days between the order ship date and the order created date within the order_items view.
-
Navigate back to the
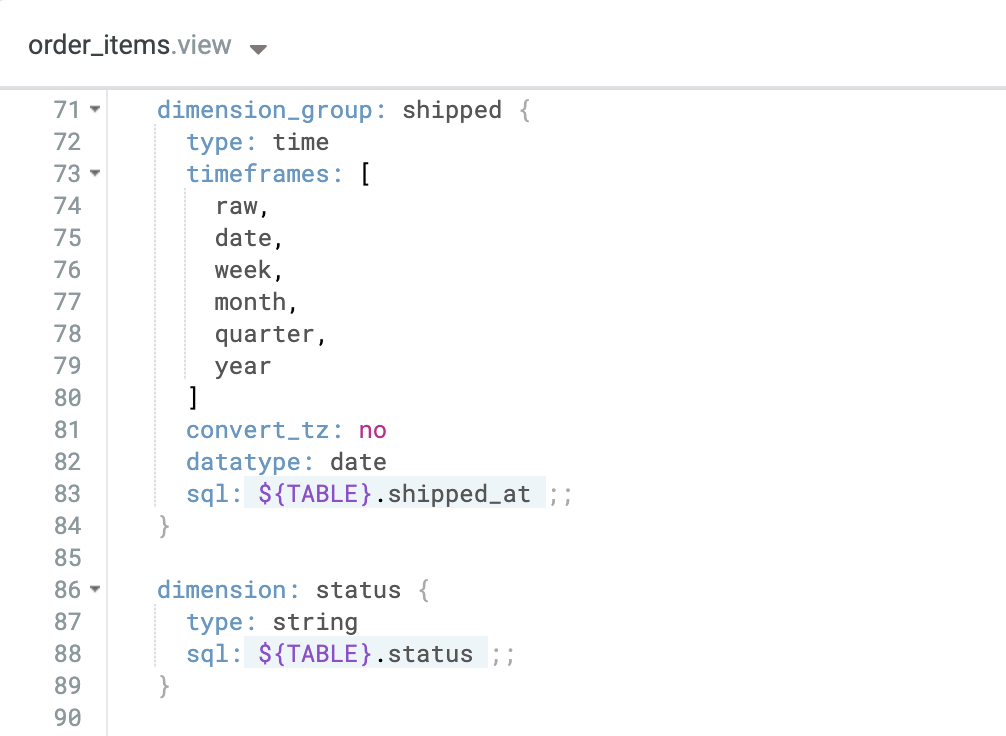
qwiklabs-ecommerceproject and open theorder_items.viewfile. -
Locate the dimension group for shipped. Your file should resemble the following:
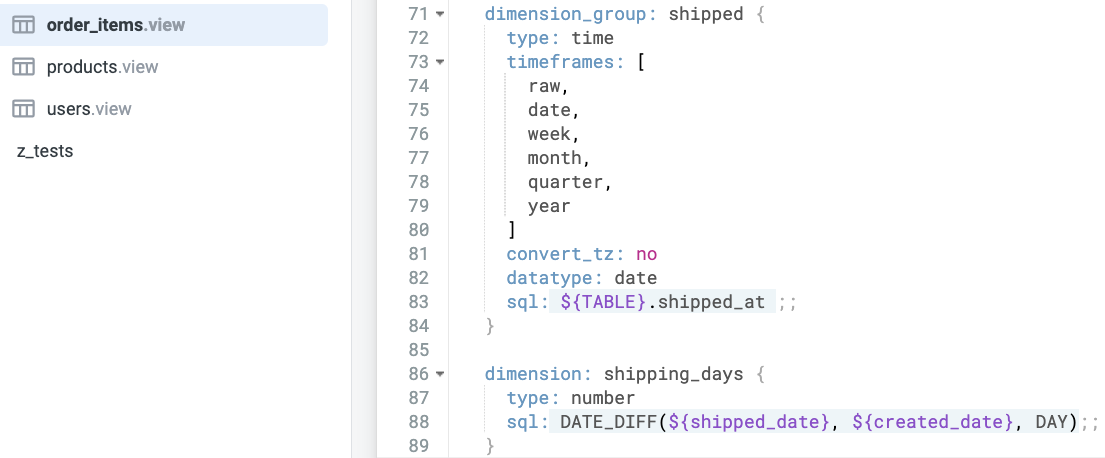
- On a new line under the dimension group for shipped, define a new dimension for shipping_days using the following code:
- Next, add the type parameter. For this dimension, you will be using the
numbertype:
- Lastly, add the SQL parameter. For this dimension, you're telling the SQL parameter to run a DATE_DIFF function on the shipped_date and created_date dimensions.
DAYis used here as the provided interval you want to be calculating:
Your file should now resemble the following:
-
Now that you finished adding a new dimension, you can test to make sure it's working properly. Click Save Changes and then click the Validate LookML button on the top right of the IDE to run a LookML code validation.
-
Click the caret next to the file title at the top of the IDE and then select Explore Order Items.
-
Next, navigate to your new dimension under Order Items > Dimensions > Shipping Days.
-
Add the Shipping Days dimension and the Order Count measure and click Run. The results are showing the count of orders with their respective shipping days. Success!
-
Navigate back to the
order_items.viewfile.
Commit changes and deploy to production
-
Click Validate LookML and then click Commit Changes & Push.
-
Add a commit message and click Commit.
-
Lastly, click Deploy to Production.
Click Check my progress to verify the objective.
Task 2. Creating measures
A measure is a field that uses a SQL aggregate function, such as COUNT, SUM, AVG, MIN, or MAX. Any field computed based on the values of other measure values is also a measure. Measures can be used to filter grouped values. For example, measures for a Sales view might include total items sold (a count), total sale price (a sum), and average sale price (an average).
The behavior and expected values for a field depend on its declared type, such as string, number, or time. For measures, types include aggregate functions, such as sum and percent_of_previous. For details, refer to dimension types and measure types.
Create a measure of the distinct number of orders
Measure fields are used to aggregate values for multiple rows. In this section, you will create a new measure named count_distinct_orders that calculates the distinct number of orders within the order_items view.
-
Navigate back to the
qwiklabs-ecommerceproject and openorder_items.viewfile. -
In
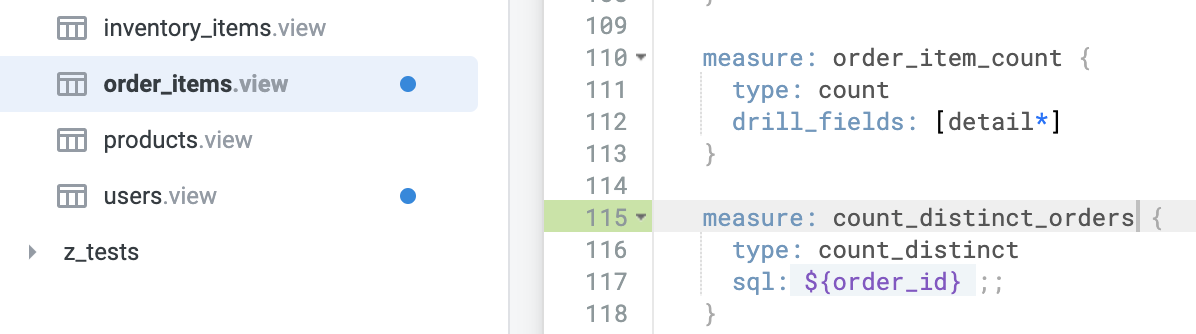
order_items.view, locate the measure for order_item_count. -
On a new line under the measure for order_item_count, start by defining a new measure for count_distinct_orders using the following code:
order_count) with count_distinct_orders.- Next, add the type parameter. For this measure, you will be using the
count_distincttype. The type count_distinct calculates the number of distinct values in a given field. It makes use of SQL’sCOUNT DISTINCTfunction:
- Lastly, add the SQL parameter. For this measure, you're telling the SQL parameter to pull from the pre-existing order_id field:
Your file should now resemble the following:
Now that you finished adding a new measure, you can test to make sure it's working properly.
-
Click Save Changes and then click the Validate LookML button on the top right of the IDE to run a LookML code validation.
-
Click the caret next to the file title at the top of the IDE and then select Explore Order Items.
-
Under Order Items > Measures, click Count Distinct Orders.
-
Click Run to see the values in the new measure. You can confirm that your new measure is working properly.
Create a total sales measure
In this section, you will create a new measure named total_sales that calculates total sales using the sale_price dimension.
-
Navigate back to the
qwiklabs-ecommerceproject and openorder_items.viewfile. -
In
order_items.view, locate the measure for order_item_count. -
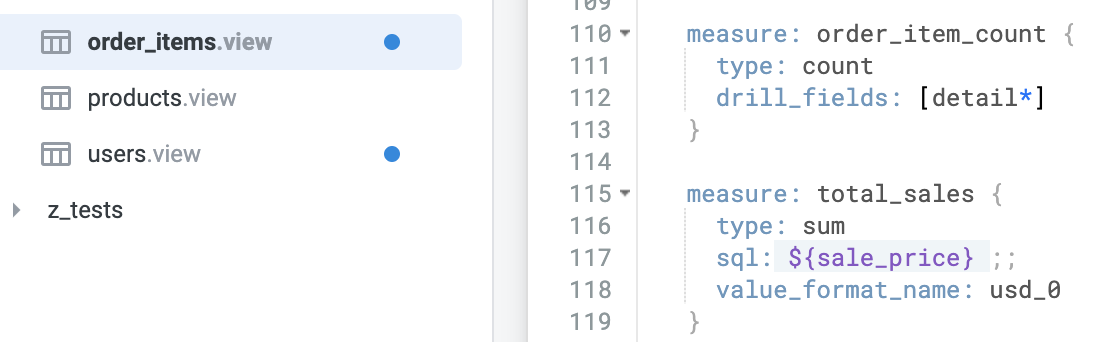
On a new line under the measure for order_item_count, start by defining a new measure for total_sales using the following code:
- Add the type parameter. Here you will be using
sum:
- Add the SQL parameter. For this measure, you're telling the SQL parameter to pull from the pre-existing sale_price field:
- Lastly, you will add the value_format_name. The
value_format_nameparameter enables you to format data values using formats built into Looker or your own custom, reusable formats. Here, since you are calculating sale price you will use US dollars (usd_0):
Your file should now resemble the following:
Now that you finished adding a new measure, you can test to make sure it's working properly.
-
Click Save Changes and then click the Validate LookML button on the top right of the IDE to run a LookML code validation.
-
Click the caret next to the file title at the top of the IDE and then select Explore Order Items.
-
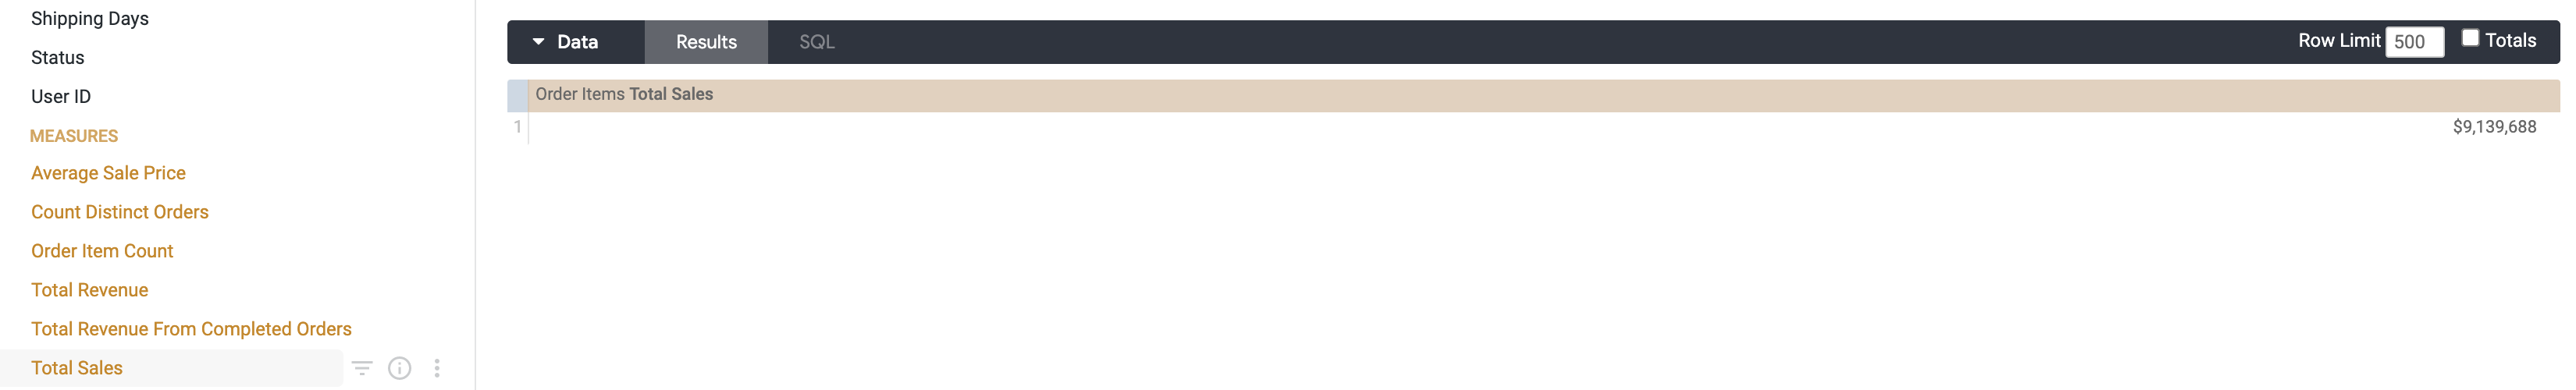
Under Order Items > Measures, click Total Sales.
-
Click Run to see the values in the new measure.
- Navigate back to the
order_items.viewfile.
Commit changes and deploy to production
-
Click Validate LookML and then click Commit Changes & Push.
-
Add a commit message and click Commit.
-
Lastly, click Deploy to Production.
Click Check my progress to verify the objective.
Task 3. Creating advanced measures
Advanced measures let you create additional custom metrics from dimensions that are defined externally to the current view file. You can also create special types of filtered measures by providing specific filtering conditions.
Create a filtered measure of the total sales for only the users who came to the website via the email traffic source
In this section, you will create a new advanced measure named total_sales_email_users that calculates total sales for only those users who came to the website via the email traffic source.
-
Navigate back to the
qwiklabs-ecommerceproject and openorder_items.viewfile. -
In
order_items.view, locate the measure for order_item_count. -
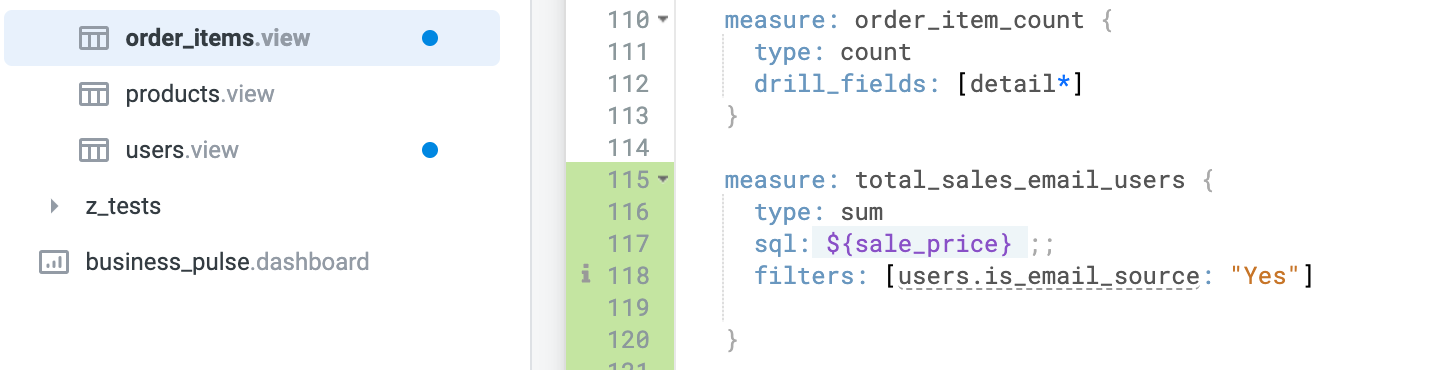
On a new line under the measure for order_item_count, start by defining a new measure for total_sales_email_users using the following code:
- Next, add the type. For this since we are calculating total sales, we will use
sum:
- Add the SQL parameter. For this measure, you're telling the SQL parameter to pull from the pre-existing sale_price field:
Lastly, you will add the filters parameter. To apply a filter directly to a measure, instead of filtering the entire query, we can add a filters parameter to the LookML definition of a measure. This will apply the filter, in the form of a CASE WHEN statement, to the measure in the generated SQL, as opposed to applying a global WHERE clause to the entire query.
As such, instead of removing rows from a query after it is aggregated, a filtered measure will only aggregate those rows that meet the specified conditions. This approach allows us to examine subsets of a population vs. other subsets or the whole.
- Add the following filter parameter. Here you are using the is_email_source dimension you created earlier within the
users.viewfile:
Your file should now resemble the following:
Now that you finished adding a new measure, you can test to make sure it's working properly.
-
Click Save Changes and then click the Validate LookML button on the top right of the IDE to run a LookML code validation.
-
Click the caret next to the file title at the top of the IDE and then select Explore Order Items.
-
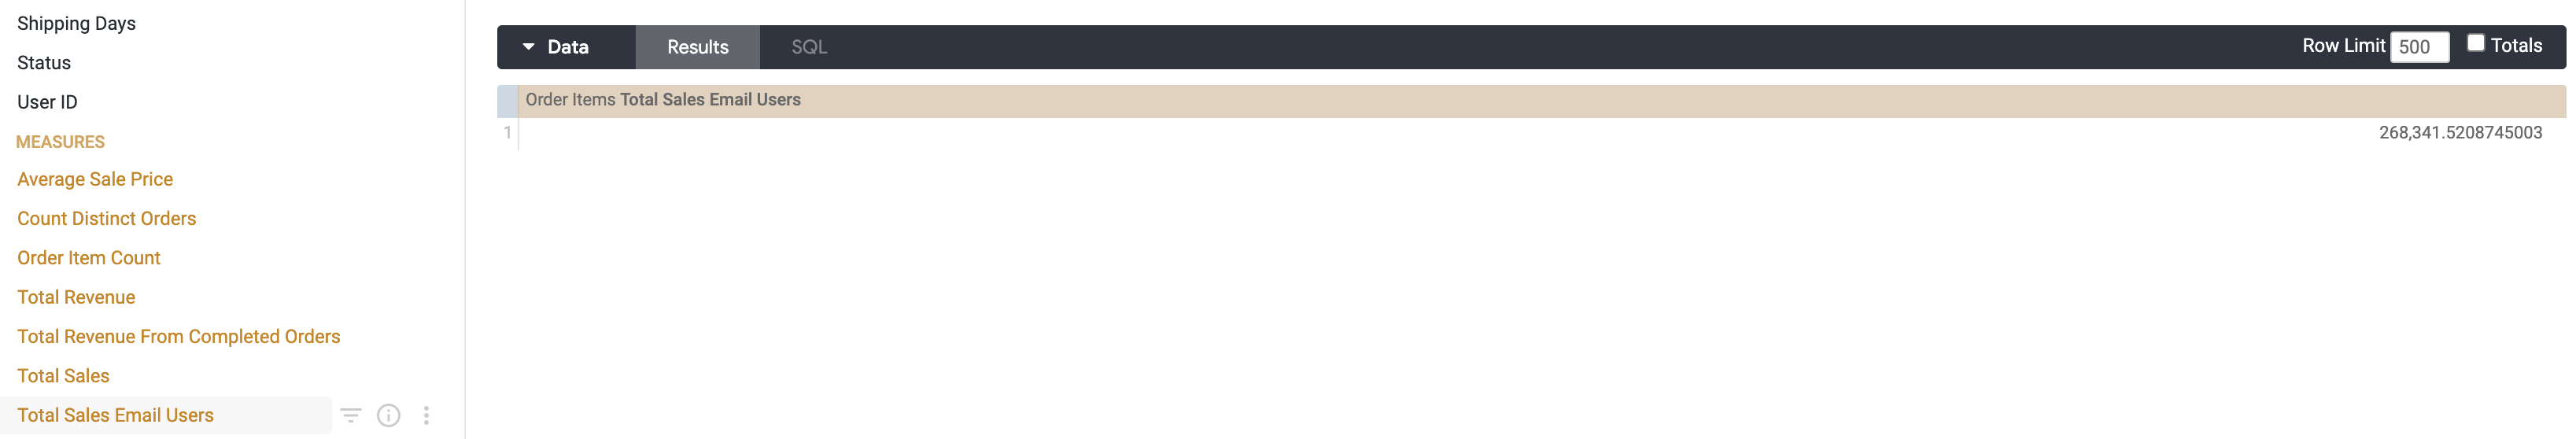
Under Order Items > Measures, click Total Sales Email Users.
-
Click Run to see the values in the new measure.
Create a measure for the percentage of sales that are attributed to users coming from the email traffic source
In this section, you will create a new advanced measure named percentage_sales_email_source that calculates the percentage of sales that are attributed to users coming from the email traffic source.
-
Navigate back to the
qwiklabs-ecommerceproject and openorder_items.viewfile. -
In
order_items.view, locate the measure for order_item_count. -
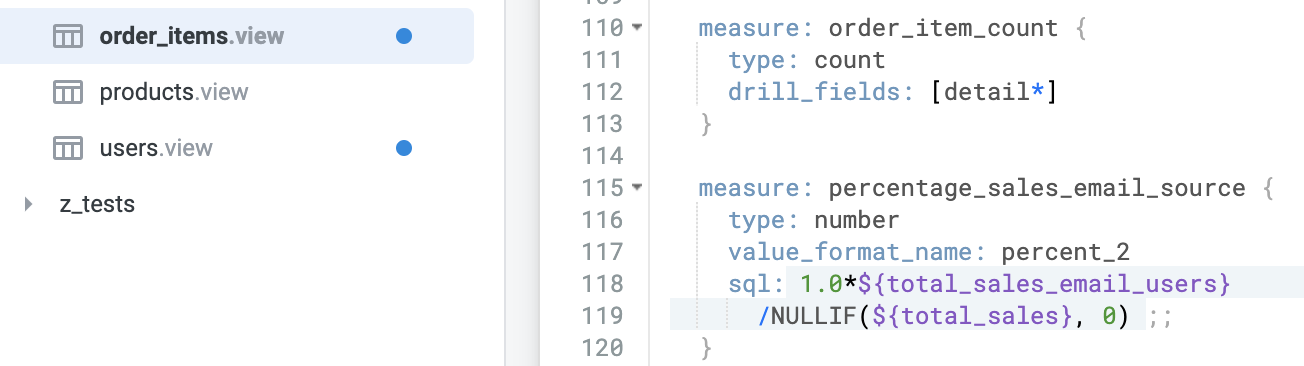
On a new line under the measure for order_item_count, start by defining a new measure for percentage_sales_email_source using the following code:
- Next, add the type. For this since we are calculating total sales, we will use
number:
- Next add the value_format_name parameter. Since you are calculating a percentage, you can use
percent_2:
- Add the SQL parameter. For this measure, you're telling the SQL parameter to pull from the pre-existing total_sales_email_users field and dividing by the total_sales:
NULLIF SQL function.
Your file should now resemble the following:
Now that you finished adding a new measure, you can test to make sure it's working properly.
-
Click Save Changes and then click the Validate LookML button on the top right of the IDE to run a LookML code validation.
-
Click the caret next to the file title at the top of the IDE and then select Explore Order Items.
-
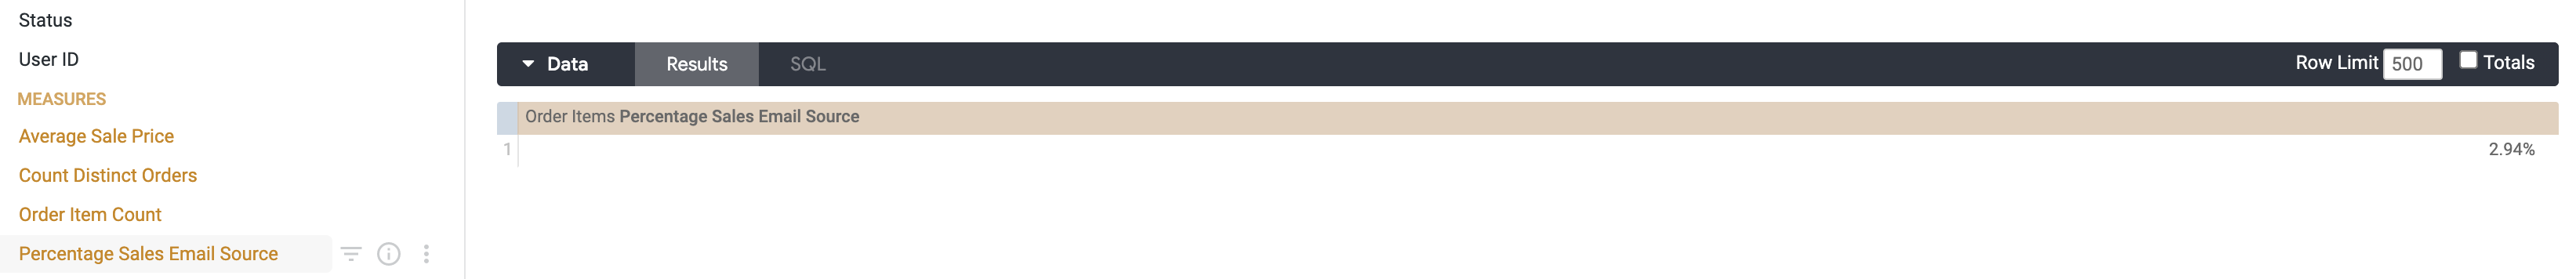
Under Order Items > Measures, click Percentage Sales Email Source.
-
Click Run to see the values in the new measure. Success!
- Navigate back to the
order_items.viewfile.
Commit changes and deploy to production
-
Click Validate LookML and then click Commit Changes & Push.
-
Add a commit message and click Commit.
-
Lastly, click Deploy to Production.
Click Check my progress to verify the objective.
Congratulations!
In this lab, you learned how to create different types of dimensions and measures in LookML as a Looker developer. You also learned how to modify models of Explores, which are data views that serve as the foundation for self-service exploration by the business users in Looker, and create advanced measures with filters.
Finish your quest
This self-paced lab is part of the Understanding LookML in Looker quest and Build LookML Objects in Looker skill badge quest. A quest is a series of related labs that form a learning path. Completing a quest earns you a badge to recognize your achievement. You can make your badge or badges public and link to them in your online resume or social media account. Enroll in any quest that contains this lab and get immediate completion credit. See the Google Cloud Skills Boost catalog to see all available quests.
Next steps / learn more
- LookML quick reference
- LookML terms and concepts
- Join the Looker Community
- Additional LookML basics
Google Cloud training and certification
...helps you make the most of Google Cloud technologies. Our classes include technical skills and best practices to help you get up to speed quickly and continue your learning journey. We offer fundamental to advanced level training, with on-demand, live, and virtual options to suit your busy schedule. Certifications help you validate and prove your skill and expertise in Google Cloud technologies.
Manual Last Updated May 18, 2023
Lab Last Tested May 18, 2023
Copyright 2024 Google LLC All rights reserved. Google and the Google logo are trademarks of Google LLC. All other company and product names may be trademarks of the respective companies with which they are associated.