Punkty kontrolne
Create a view
/ 50
Join view to an explore
/ 50
Looker Developer - Qwik Start
GSP891

Overview
Looker is a modern data platform in Google Cloud that lets you analyze and visualize your data interactively. You can use Looker to do in-depth data analysis, integrate insights across different data sources, build actionable data-driven workflows, and create custom data applications.
What is LookML?
LookML (Looker Modeling Language) generates abstracted SQL and provides a modeling layer between the database and user. It is Looker’s proprietary language that provides an abstraction layer for SQL databases.
Specifically, LookML is a language for describing dimensions, aggregates, calculations, and data relationships in a SQL database. Looker uses a model written in LookML to construct SQL queries against a particular database. It creates the layer between that SQL database and how the business user interacts with it.
As such, it defines many different things, like how to join tables, how to define custom tables, how to define fields from the database, and the logic for new fields. In this lab, you will get hands-on experience with the fundamentals of LookML.
Setup and requirements
Before you click the Start Lab button
Read these instructions. Labs are timed and you cannot pause them. The timer, which starts when you click Start Lab, shows how long Google Cloud resources will be made available to you.
This hands-on lab lets you do the lab activities yourself in a real cloud environment, not in a simulation or demo environment. It does so by giving you new, temporary credentials that you use to sign in and access Google Cloud for the duration of the lab.
To complete this lab, you need:
- Access to a standard internet browser (Chrome browser recommended).
- Time to complete the lab---remember, once you start, you cannot pause a lab.
How to start your lab and sign in to Looker
-
When ready, click
.
A new panel will appear with the temporary credentials that you must use for this lab.
If you need to pay for the lab, a pop-up will open for you to select your payment method.
-
Note your lab credentials in the left pane. You will use them to sign in to the Looker instance for this lab.
Note: If you use other credentials, you will get errors or incur charges. -
Click Open Looker.
-
Enter the provided Username and Password in the Email and Password fields.
Important: You must use the credentials from the Connection Details panel on this page. Do not use your Google Cloud Skills Boost credentials. If you have your own Looker account, do not use it for this lab. -
Click Log In.
After a successful login, you will see the Looker instance for this lab.
Overview of LookML structures
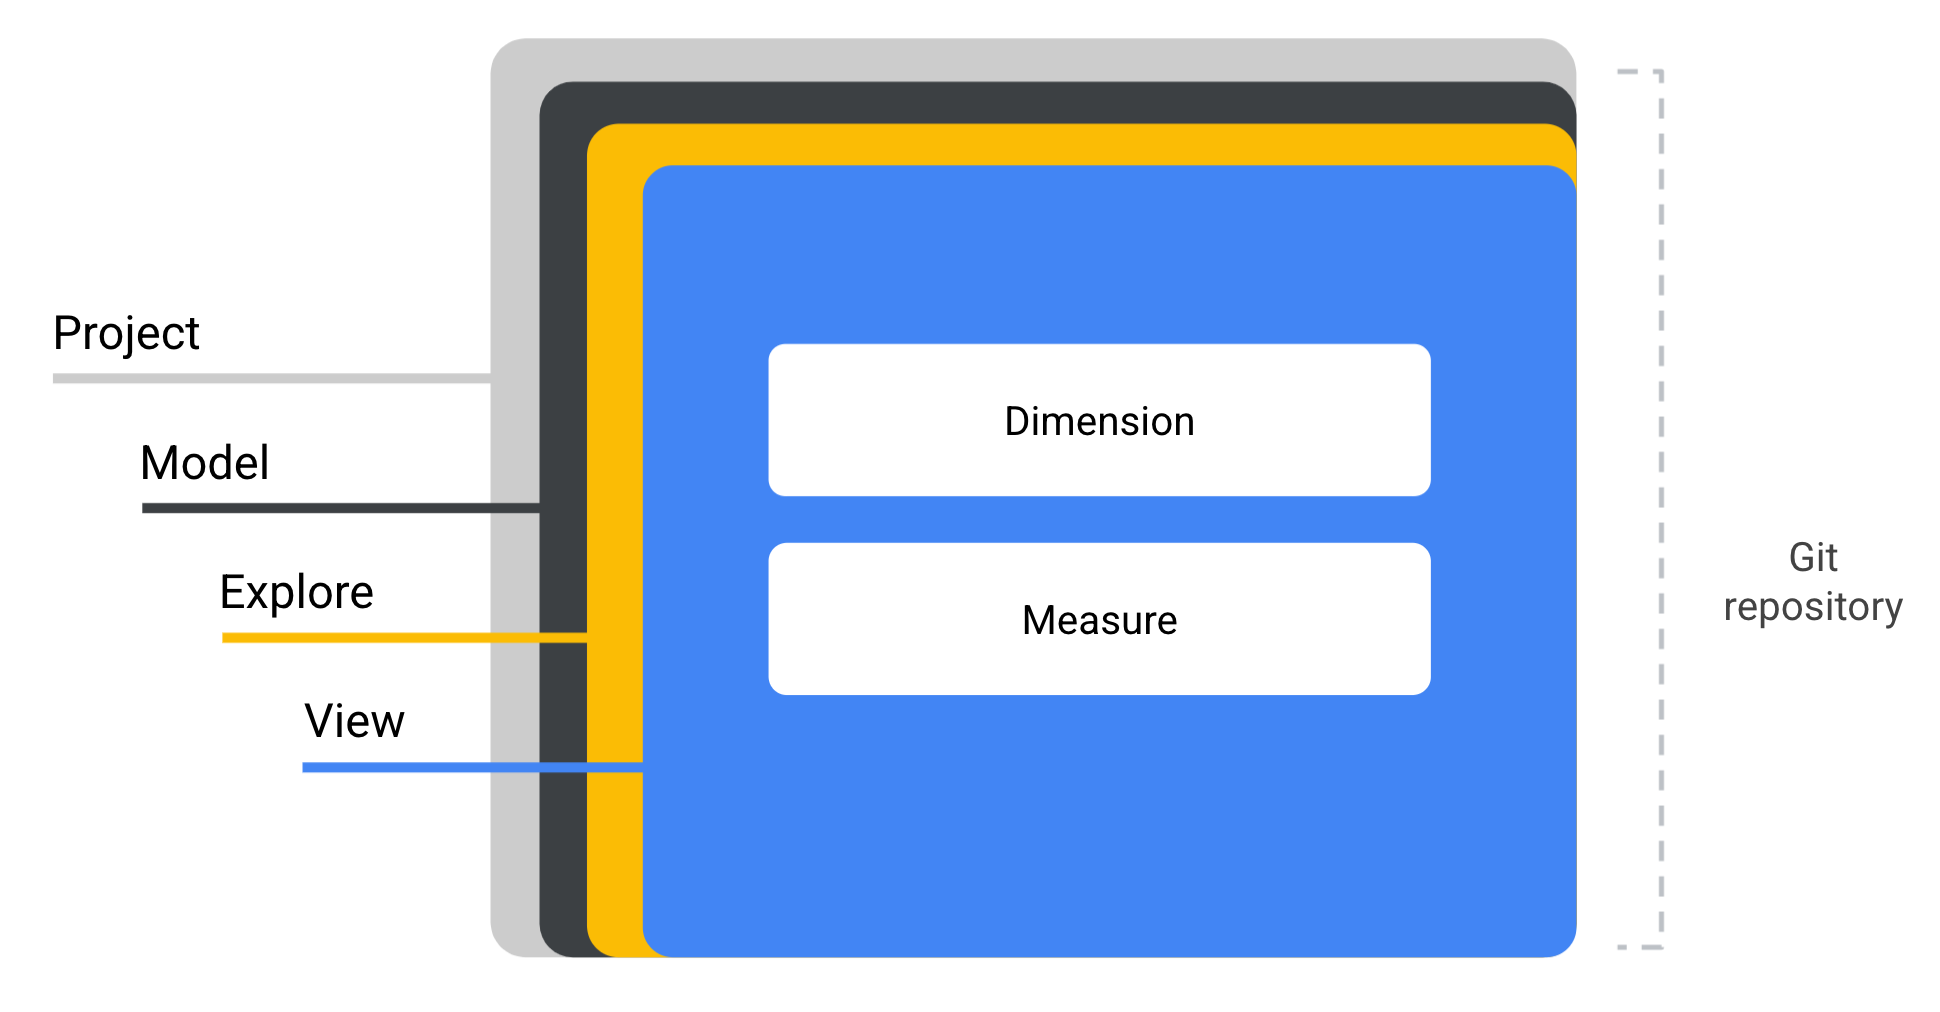
The hierarchy of LookML is structured using the following objects:
-
Projects, which are libraries of LookML code. Because Looker uses Git for version control, a best practice is for each project to map 1:1 with a Git repository.
- A project is composed of one or more models.
- A model is a set of Explores by business area or need. An Explore is a set of pre-joined views for business-user analysis.
- Each model contains one or more Explores.
- A view in LookML is a database table or a logical representation of one.
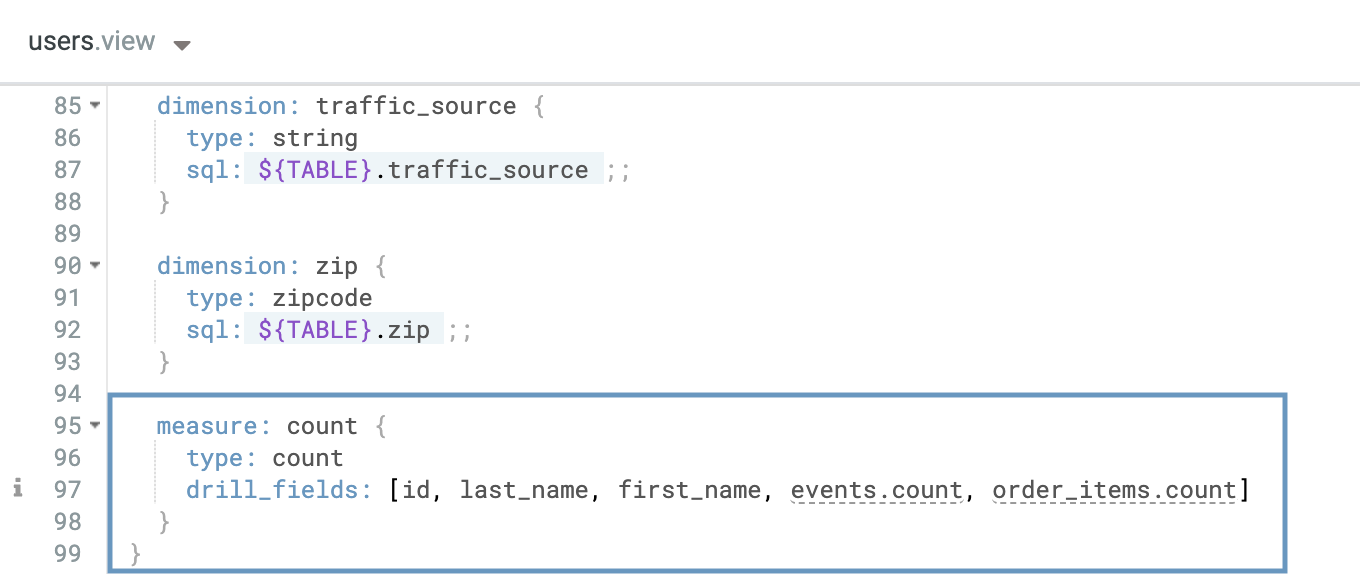
- Each view includes dimensions (which are database columns or logical representations of them) and measures (which are aggregate functions on dimensions, such as a
COUNTof customers or aSUMof cost).
- Each view includes dimensions (which are database columns or logical representations of them) and measures (which are aggregate functions on dimensions, such as a
Projects
The highest-level LookML object is the project. A project is essentially a library of code that typically maps 1:1 to a data source or database connection. You can think of each project as an almost independent mini-instance or microcosm of Looker.
Schemas that cannot be joined together usually reside in different projects because there is no relation to be made across the two datasets. This depends on your database dialect and database user permissions.
A key concept to remember is: if it’s possible in your SQL dialect, it should be possible in Looker. If you can go to your database console and hand-write a SELECT statement that does a thing, you can also code LookML so that Looker does the same thing.
You can share content from one project to another via a feature called Project Import, if necessary, and if it’s enabled for your instance, but this is an advanced approach to setting up your model architecture and not in the scope of this lab.
Models
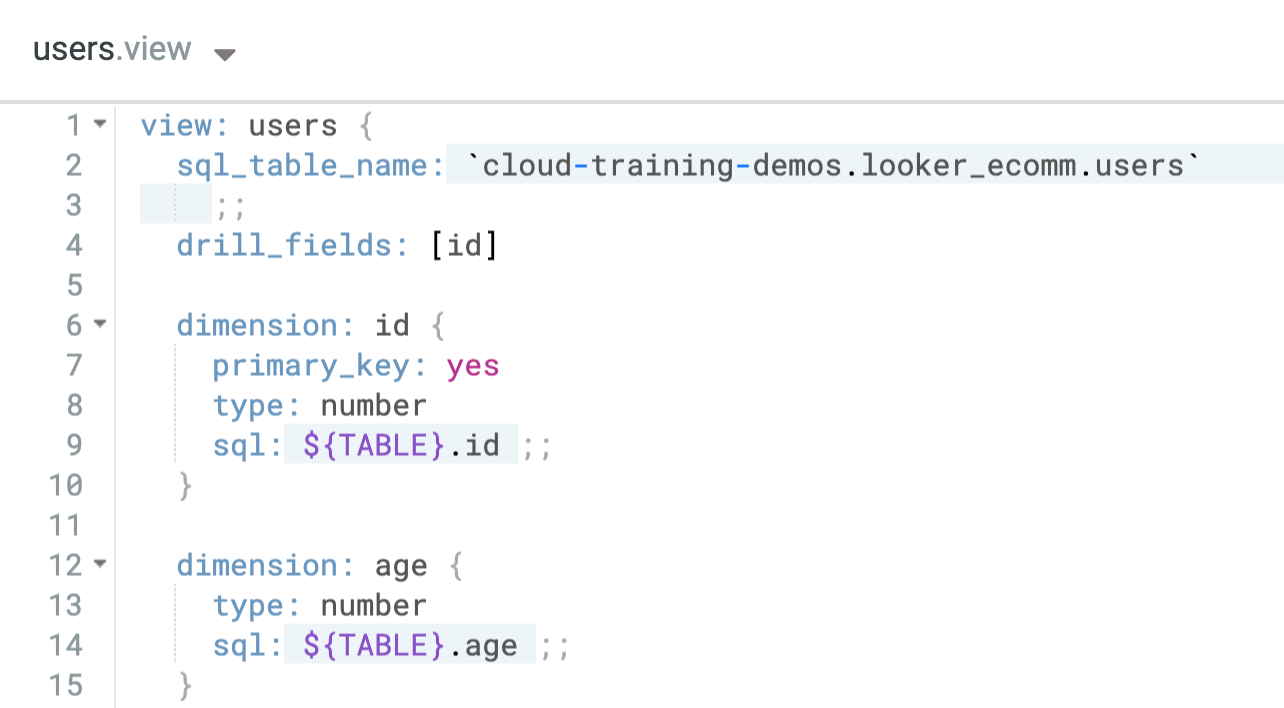
Models are the next level of hierarchy and contain:
- The database connection you are using, as defined in the image by line 1.
- View files that are accessible to this model, as defined by lines 4, 5, and 6.
- Definitions of Explores and their join logic.

Models contain data connection information and definitions of Explores. Models can be used to restrict user access to certain Explores and separate and organize Explores by business area.
Explores
Explores are one or more views joined together, usually to target a specific business question. Explores should be organized around business themes to minimize confusion for users.
Explores are the “drivers” of analysis on the frontend. They include one or more views joined together, and each usually targets a specific business question. Think of an Explore as a predefined set of tables that would frequently be joined for business inquiries and use cases.
Views
Views are where you define dimensions (which are the data attributes) and measures (which are aggregations of dimensions). Think of views as tables that bundle related fields. There are a few different types of views:
- Standard views, which abstract what’s already in the database tables.
- Virtual tables, known as derived tables, which are discussed later in this quest.
Dimensions
The lowest level of a LookML object are fields, which can be dimensions or measures. Dimensions are created for any columns that are already in your database tables when the view files are generated from a table by Looker.
You can also create additional dimensions that would serve as logical representations of table columns. These appear in the SELECT and GROUP BY clause of a SQL statement. They are the “attributes” that describe your data.
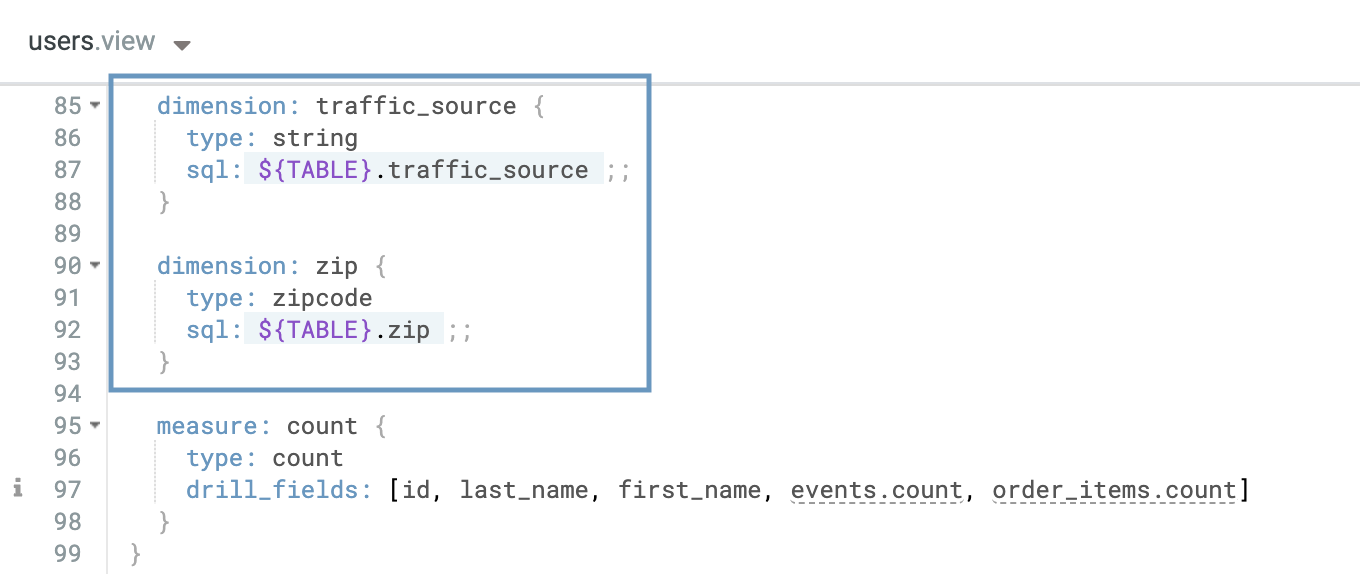
Measures
Measures are aggregates that do not live explicitly in your database tables. They must be created in LookML. They aggregate dimensions into values like sums or counts.
Note that they do not appear in the GROUP BY statement of the SQL generated by Looker. Instead, they depend on dimensions to determine that grouping.
LookML hierarchy recap
To recap, a project is a library of code that models a data source and should map 1:1 to a Git repository. Projects contain:
- Model files, which define the Explores that should be packaged together and how those Explores work.
- View files, which describe database tables or logical representations of them.
Dimensions and measures are defined within view files.
Projects can also include dashboards defined in LookML to prevent business users from editing them, maintain version control, and sync them across Looker instances if your company has more than one. LookML dashboards are not in the scope of this training.
There are other types of project files, such as documents and manifests, which are not in the scope of this lab. If you're interested, you can refer to the Understanding other project files documentation.
Task 1. Create a view
In this section, you will create a new view and add some dimensions and measures to it.
- First, on the bottom left of the Looker User Interface, click the toggle button to enter Development mode.

-
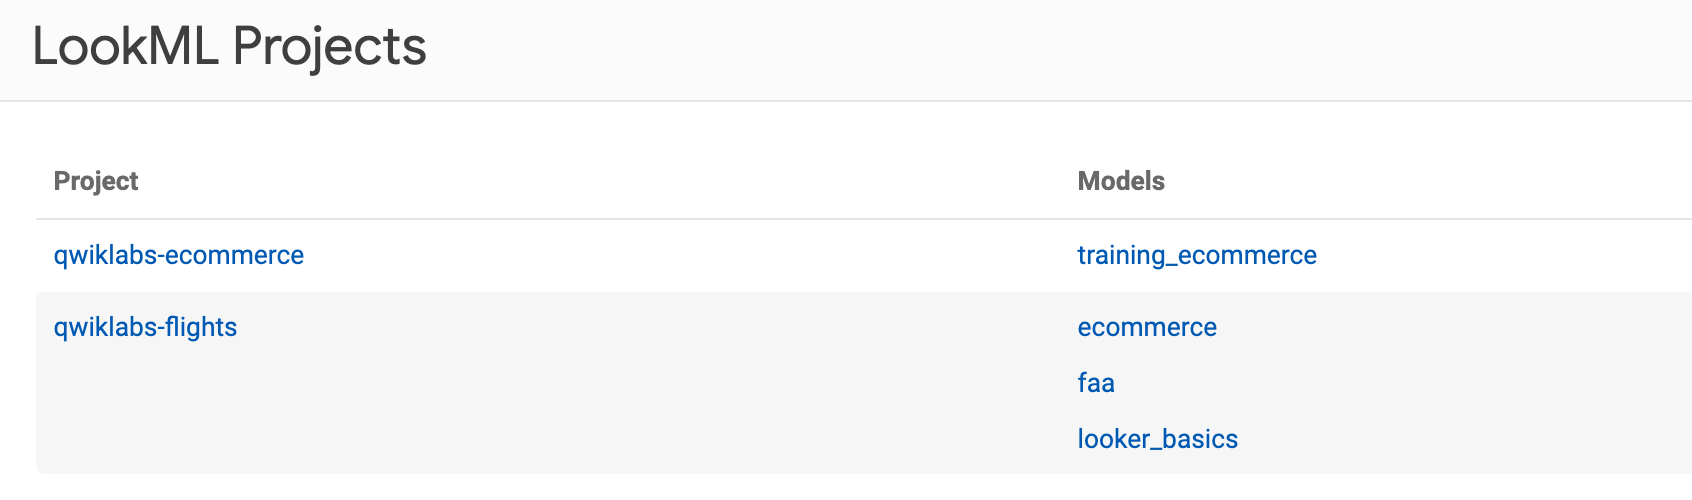
Click the Develop tab and then select the
qwiklabs-ecommerceLookML project. -
To create the file at the project’s root level, click the + button at the top of the file browser in the Looker IDE.
-
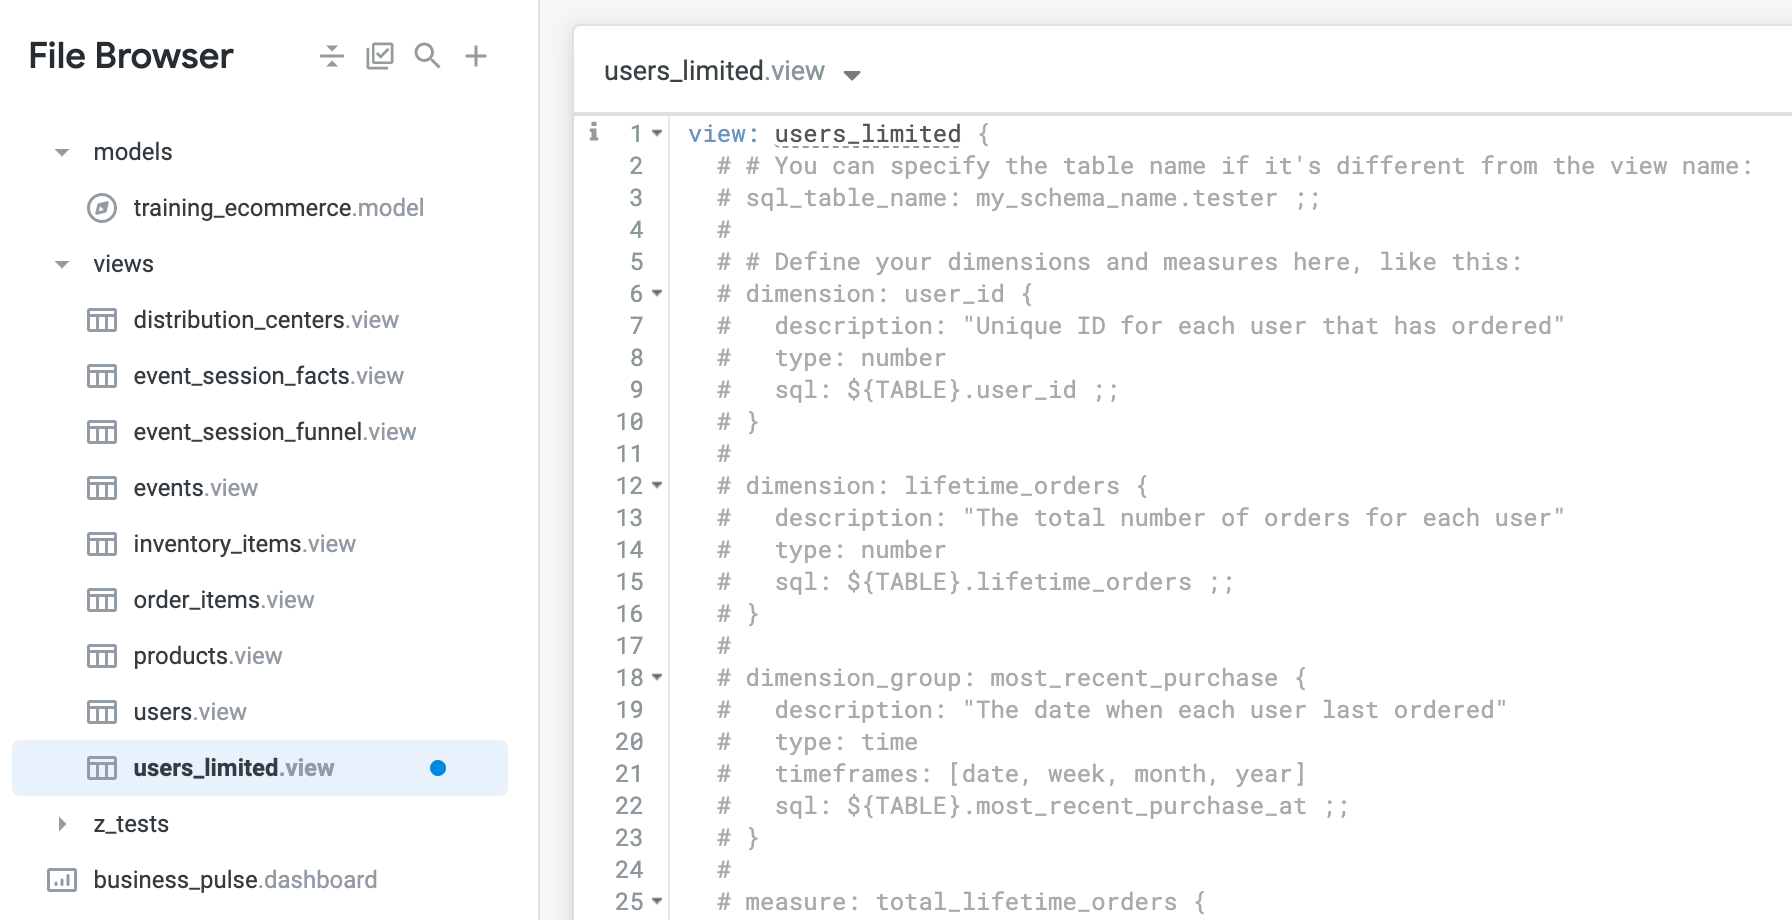
Select Create View. Name the file
users_limited. Click Create. -
After you have created your new view, click the arrow next to the views folder to see a list of the existing views for the project.
-
To put your view file into the views folder, click and hold the
users_limitedfile and drag it into the expanded folder. Your project should resemble the following:
Add some dimensions and measures
Now that you have created a new view file and organized it in your project file browser, you're ready to add some content to it.
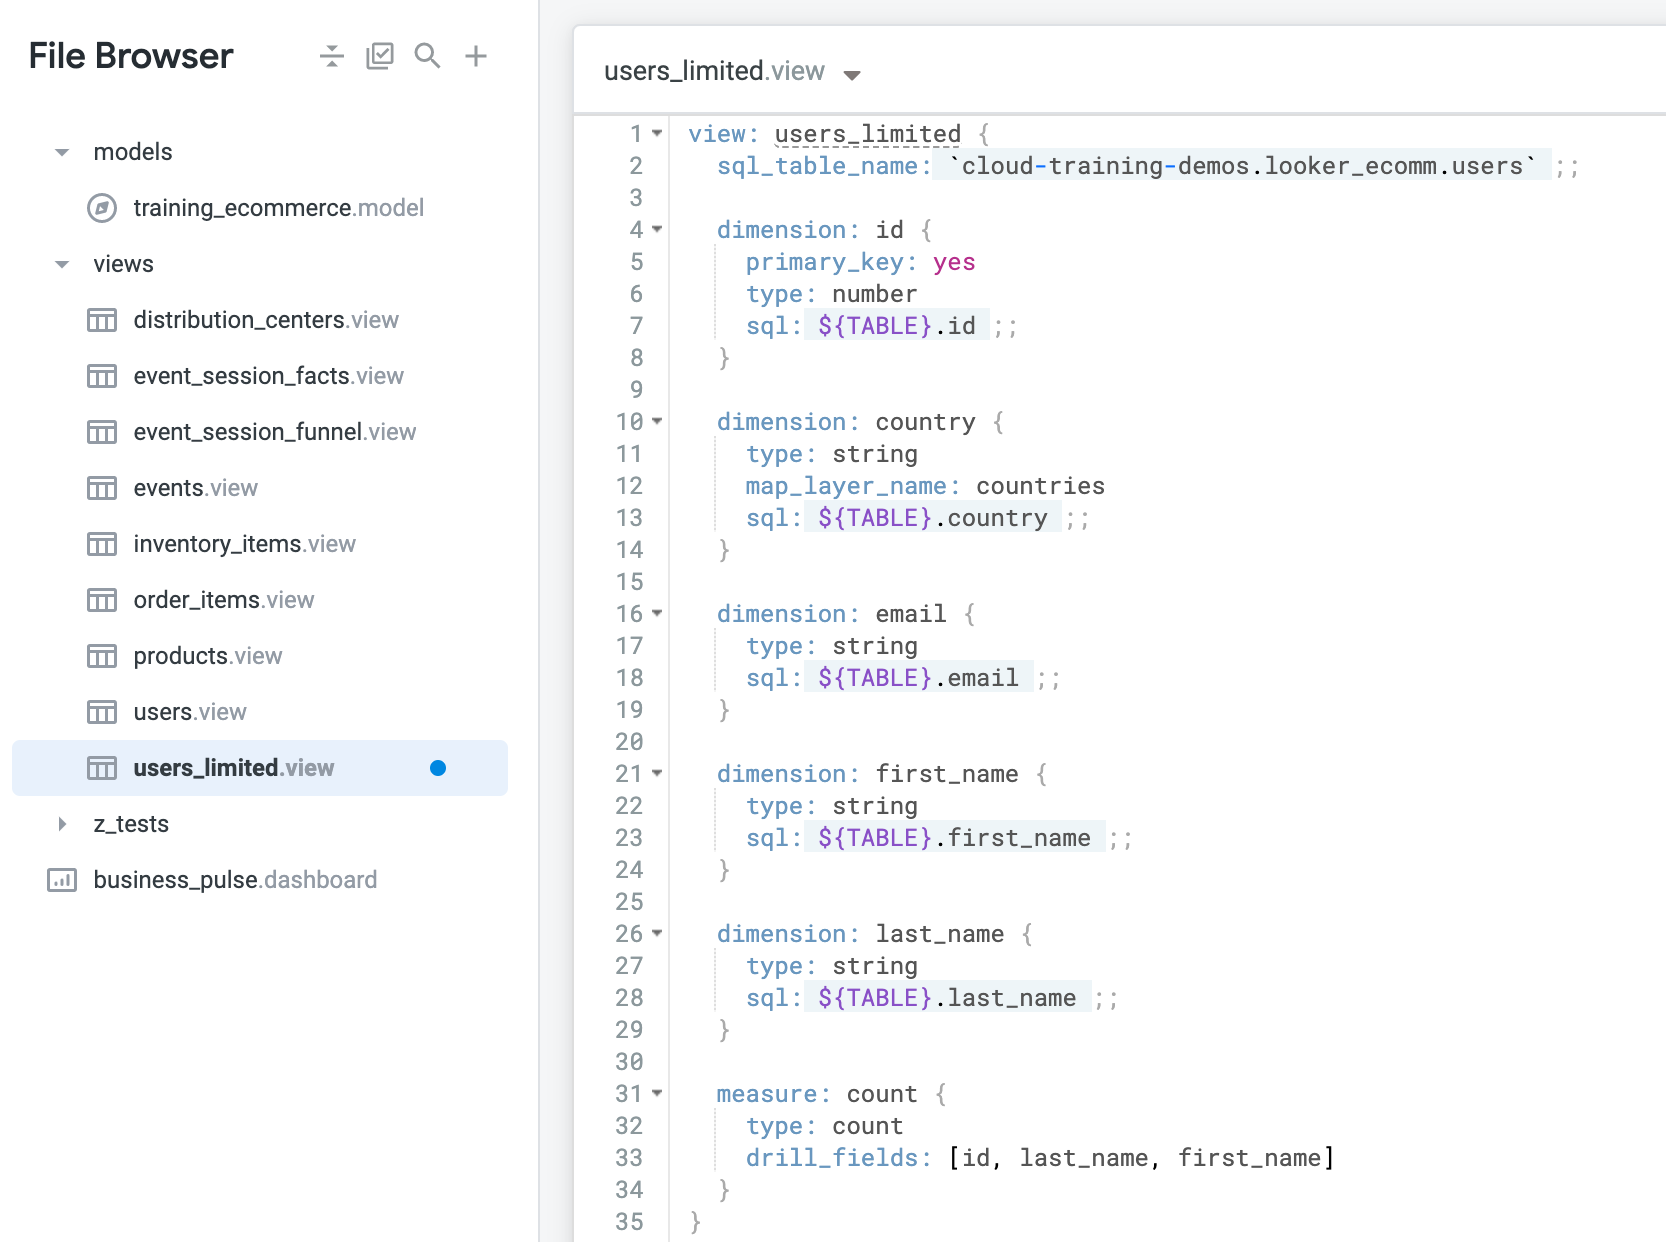
- Start by specifying the view name and the SQL table name you want to connect your view to. For this example, you will be connecting to the dataset used for the
qwiklabs_ecommerceproject. This is the same table forusers.view. Add the following code on line 2:
- Now add a few dimensions. Here you will be adding the user
id,country,email,first_name, andlast_name:
- Next, add a measure. This will be used for counting specific dimensions:
- Click Save Changes. Great! You're all done adding dimensions and measures to your new view. Your file should resemble the following:
Commit changes and deploy to production
-
Click Validate LookML and then click Commit Changes & Push.
-
Add a commit message and click Commit.
-
Lastly, click Deploy to Production.
Click Check my progress to verify the objective.
Task 2. Join a view to an existing explore
-
In the file browser, under the models folder, navigate to the
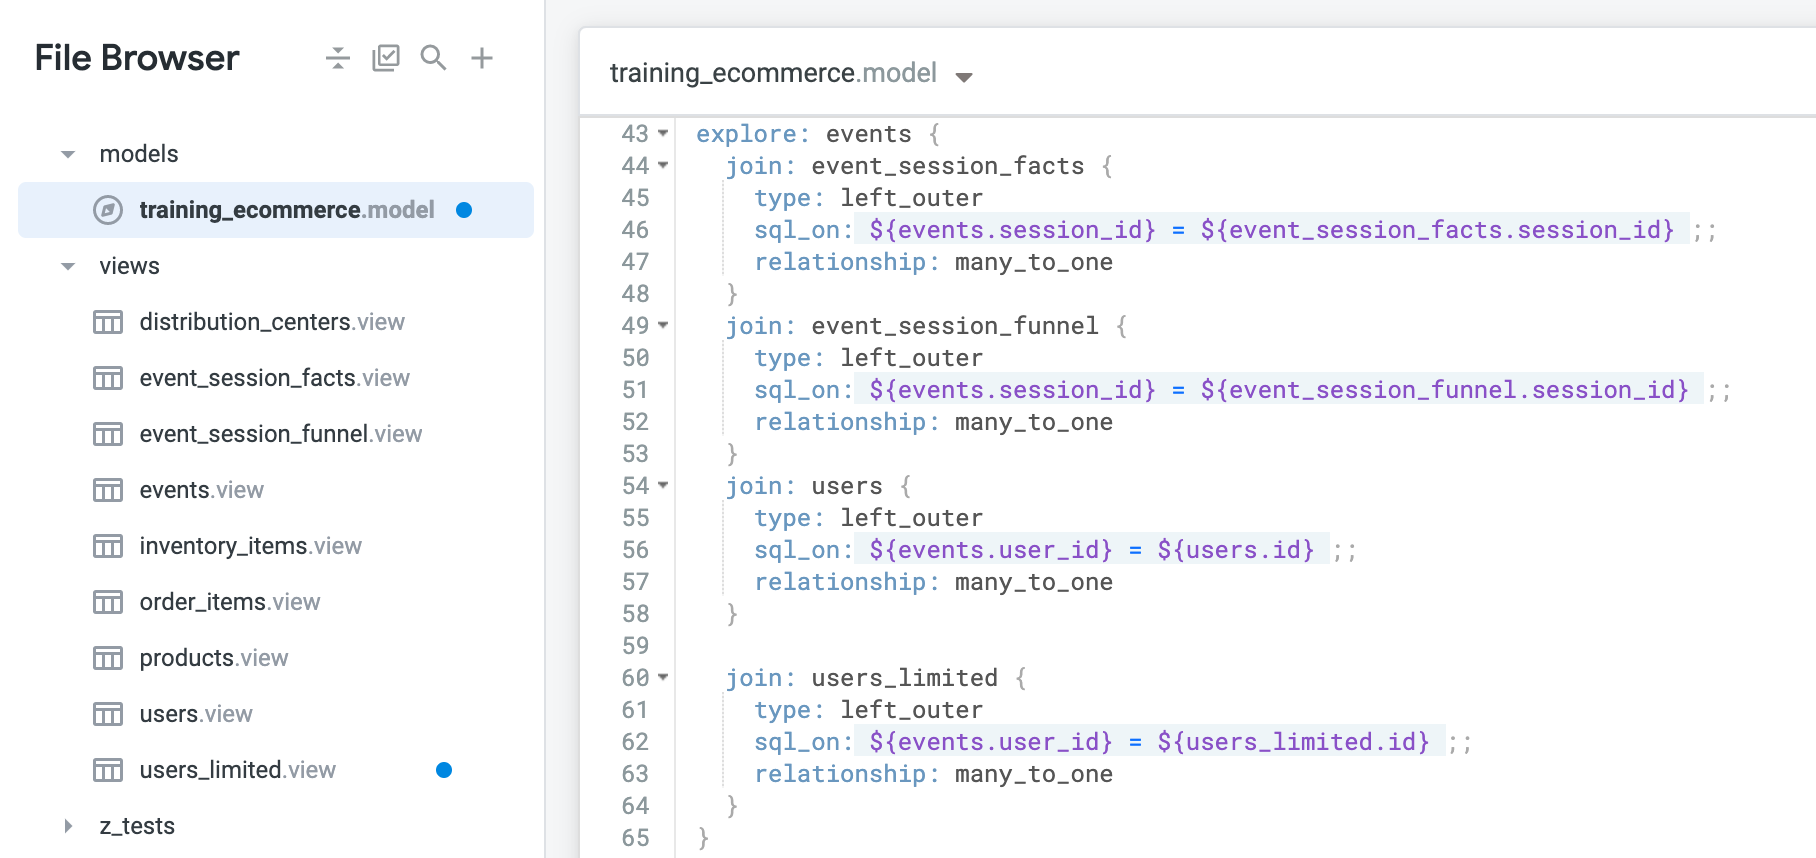
training_ecommerce.modelfile. -
In the
explore: eventsdefinition, add a new line afterjoin: users, and paste the following:
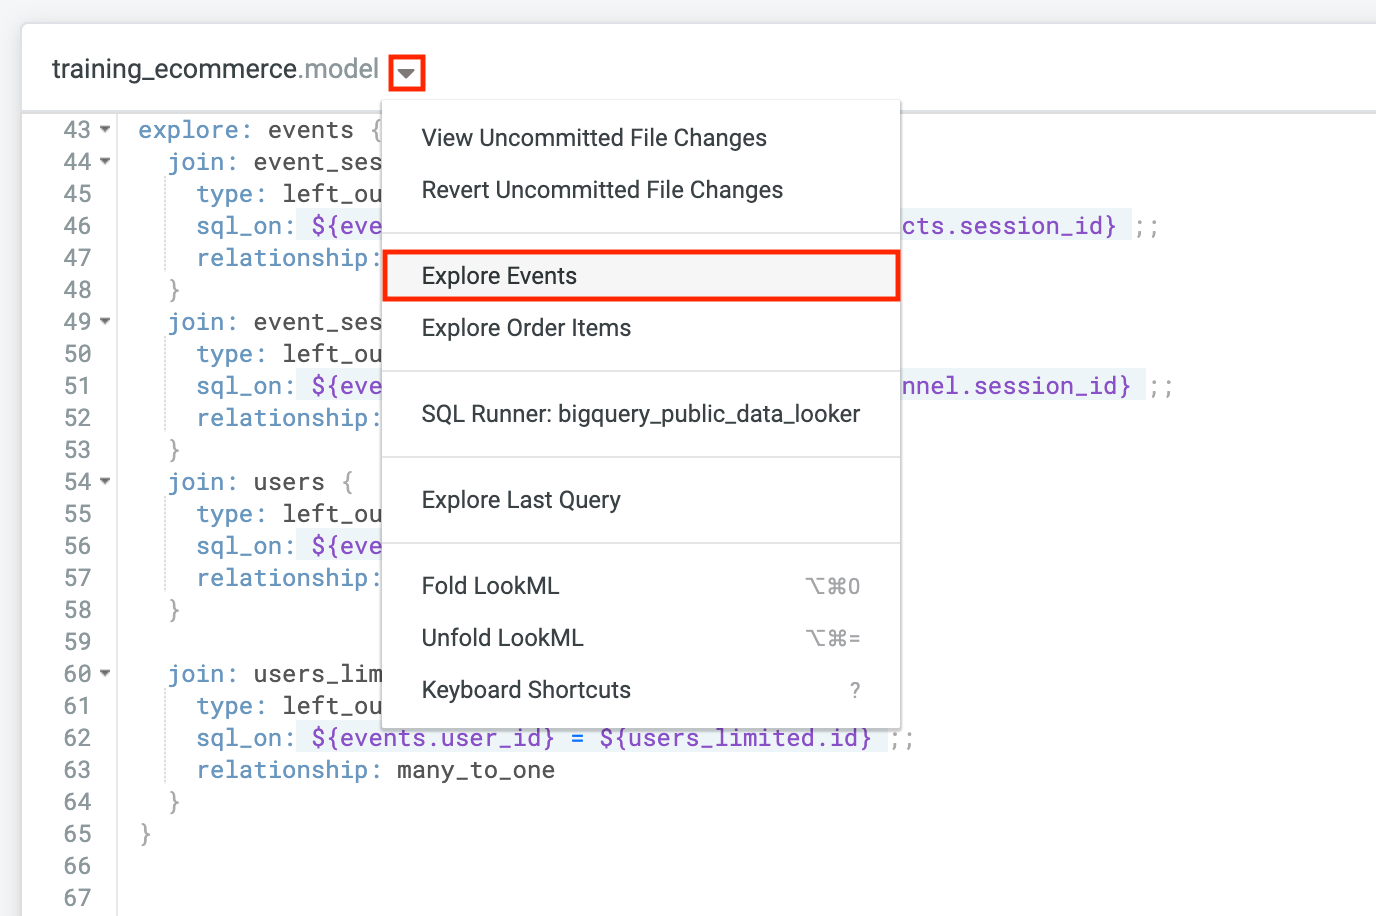
- Click Save Changes. Your project file should now resemble the following:
- Click the caret next to the file title at the top of the IDE and then select Explore Events.
- Next, navigate to your new view in the Explore page by selecting Users Limited.
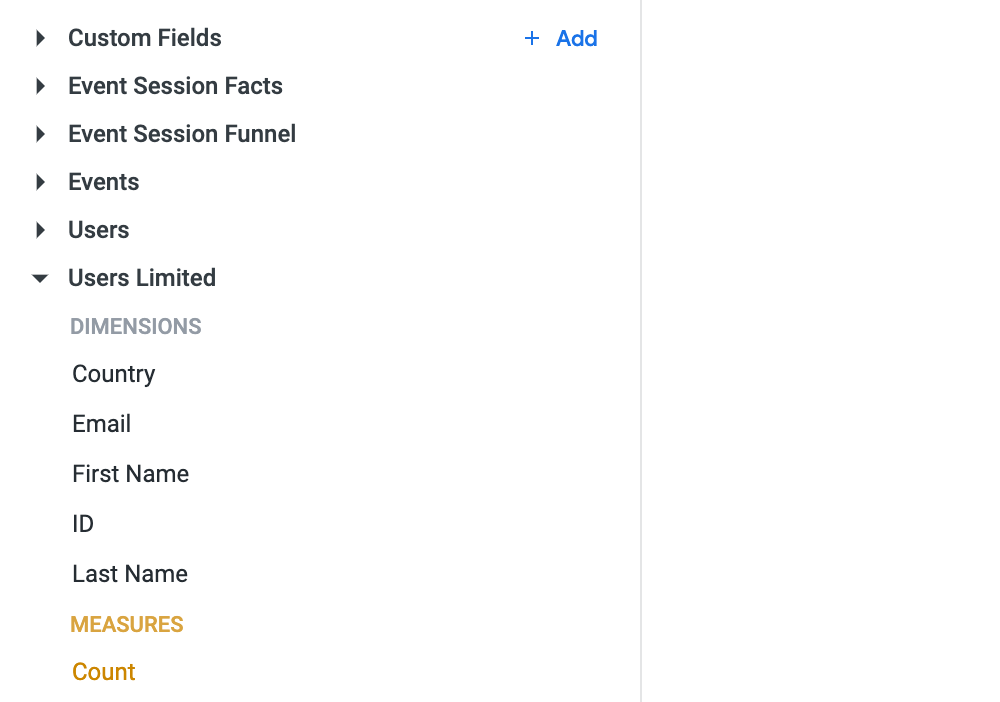
-
Under Users Limited, select the First Name dimension and the Count measure.
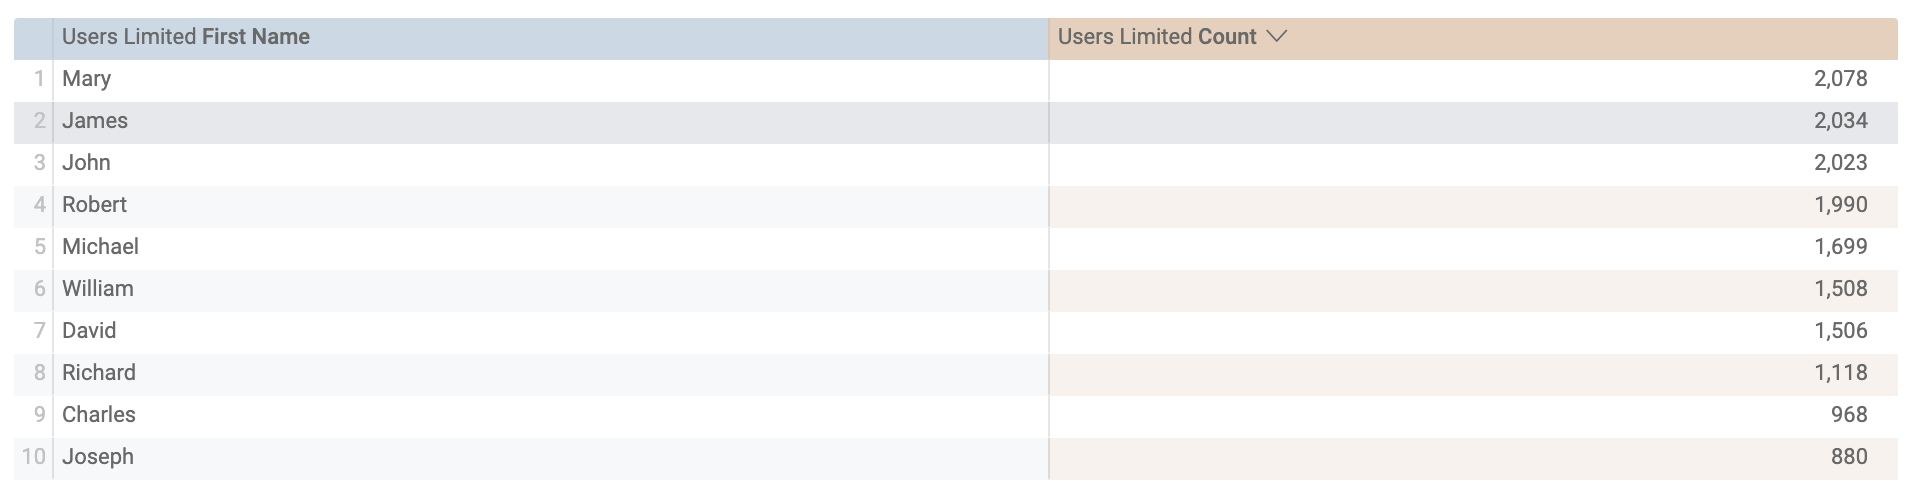
-
Click Run. Your visualization should resemble the following:
- Navigate back to the
training_ecommerce.modelfile.
Commit changes and deploy to production
-
Click Validate LookML and then click Commit Changes & Push.
-
Add a commit message and click Commit.
-
Lastly, click Deploy to Production.
Click Check my progress to verify the objective.
Congratulations!
In this lab you learned how to define and read core LookML terms and concepts. You then learned how to organize and understand the main LookML structures and hierarchy, created a view, added dimensions and measures to it, and joined the view to an existing Explore.
Finish your quest
This self-paced lab is part of the Understanding LookML in Looker quest and Build LookML Objects in Looker skill badge quest. A quest is a series of related labs that form a learning path. Completing a quest earns you a badge to recognize your achievement. You can make your badge or badges public and link to them in your online resume or social media account. Enroll in any quest that contains this lab and get immediate completion credit. See the Google Cloud Skills Boost catalog to see all available quests.
Next steps / Learn more
- LookML quick reference
- LookML terms and concepts
- Join the Looker Community
- Additional LookML basics
Google Cloud training and certification
...helps you make the most of Google Cloud technologies. Our classes include technical skills and best practices to help you get up to speed quickly and continue your learning journey. We offer fundamental to advanced level training, with on-demand, live, and virtual options to suit your busy schedule. Certifications help you validate and prove your skill and expertise in Google Cloud technologies.
Manual Last Updated August 29, 2022
Lab Last Tested October 21, 2021
Copyright 2024 Google LLC All rights reserved. Google and the Google logo are trademarks of Google LLC. All other company and product names may be trademarks of the respective companies with which they are associated.