Prüfpunkte
Identify duplicate rows
/ 30
Write basic SQL on ecommerce data
/ 70
Explore an Ecommerce Dataset with SQL in BigQuery
GSP407

Overview
BigQuery is Google's fully managed, NoOps, low cost analytics database. With BigQuery you can query terabytes and terabytes of data without having any infrastructure to manage or needing a database administrator. BigQuery uses SQL and can take advantage of the pay-as-you-go model. BigQuery allows you to focus on analyzing data to find meaningful insights.
We have a newly available ecommerce dataset that has millions of Google Analytics records for the Google Merchandise Store loaded into a table in BigQuery. In this lab, you use a copy of that dataset. Sample scenarios are provided, from which you look at the data and ways to remove duplicate information. The lab then steps you through further analysis the data.
To follow and experiment with the BigQuery queries provided to analyze the data, see the BigQuery Query Syntax Reference.
Objectives
In this lab, you use BigQuery to:
- Access an ecommerce dataset
- Look at the dataset metadata
- Remove duplicate entries
- Write and execute queries
Setup and requirements
Before you click the Start Lab button
Read these instructions. Labs are timed and you cannot pause them. The timer, which starts when you click Start Lab, shows how long Google Cloud resources will be made available to you.
This hands-on lab lets you do the lab activities yourself in a real cloud environment, not in a simulation or demo environment. It does so by giving you new, temporary credentials that you use to sign in and access Google Cloud for the duration of the lab.
To complete this lab, you need:
- Access to a standard internet browser (Chrome browser recommended).
- Time to complete the lab---remember, once you start, you cannot pause a lab.
How to start your lab and sign in to the Google Cloud console
-
Click the Start Lab button. If you need to pay for the lab, a pop-up opens for you to select your payment method. On the left is the Lab Details panel with the following:
- The Open Google Cloud console button
- Time remaining
- The temporary credentials that you must use for this lab
- Other information, if needed, to step through this lab
-
Click Open Google Cloud console (or right-click and select Open Link in Incognito Window if you are running the Chrome browser).
The lab spins up resources, and then opens another tab that shows the Sign in page.
Tip: Arrange the tabs in separate windows, side-by-side.
Note: If you see the Choose an account dialog, click Use Another Account. -
If necessary, copy the Username below and paste it into the Sign in dialog.
{{{user_0.username | "Username"}}} You can also find the Username in the Lab Details panel.
-
Click Next.
-
Copy the Password below and paste it into the Welcome dialog.
{{{user_0.password | "Password"}}} You can also find the Password in the Lab Details panel.
-
Click Next.
Important: You must use the credentials the lab provides you. Do not use your Google Cloud account credentials. Note: Using your own Google Cloud account for this lab may incur extra charges. -
Click through the subsequent pages:
- Accept the terms and conditions.
- Do not add recovery options or two-factor authentication (because this is a temporary account).
- Do not sign up for free trials.
After a few moments, the Google Cloud console opens in this tab.

Task 1. Pin the lab project in BigQuery
In this section, you add the data-to-insights project to your environment resources.
- Click Navigation menu > BigQuery.
The Welcome to BigQuery in the Cloud Console message box opens.
- Click Done.
BigQuery public datasets are not displayed by default in the BigQuery web UI. To open the public datasets project, copy "data-to-insights".
- Click + Add > Star a project by name, then set the name to
data-to-insights. Click STAR.
The Explorer section now lists the data-to-insights project.
Task 2. Explore ecommerce data and identify duplicate records
Scenario: Your data analyst team exported the Google Analytics logs for an ecommerce website into BigQuery and created a new table of all the raw ecommerce visitor session data.
Explore the all_sessions_raw table data:
- Click the Expand node icon near data-to-insights to expand the project.
- Expand ecommerce.
- Click all_sessions_raw.
In the right pane, a section opens that provides 3 views of the table data:
- Schema tab: Field name, Type, Mode, and Description; the logical constraints used to organize the data
- Details tab: Table metadata
- Preview tab: Table preview
- Click the Details tab to view the table metadata.
Questions:
Identify duplicate rows
Seeing a sample amount of data may give you greater intuition for what is included in the dataset.
-
To preview sample rows from the table without using SQL, click the preview tab.
-
Scan and scroll through the rows. There is no singular field that uniquely identifies a row, so you need advanced logic to identify duplicate rows.
-
The query you'll use (below) uses the SQL
GROUP BYfunction on every field and counts (COUNT) where there are rows that have the same values across every field:
- If every field is unique, the
COUNTreturns 1 as there are no other groupings of rows with the exact same value for all fields. - If there are multiple rows with the same values for all fields, these rows are grouped together and the
COUNTwill be greater than 1.
The last part of the query is an aggregation filter using HAVING to only show the results that have a COUNT of duplicates greater than 1. Therefore, the number of records that have duplicates will be the same as the number of rows in the resulting table.
- Copy and paste the following query into the query Editor, then RUN query to find which records are duplicated across all columns.
Click Check my progress to verify the objective.
Analyze the new all_sessions table
In this section, you use a deduplicated table called all_sessions.
Scenario: Your data analyst team has provided you with this query, and your schema experts have identified the key fields that must be unique for each record per your schema.
- Run the query to confirm that no duplicates exist, this time in the
all_sessionstable:
The query returns zero records.
GROUP BY 1 instead of GROUP BY fullVisitorId.Task 3. Write basic SQL on ecommerce data
In this section, you query for insights on the ecommerce dataset.
Write a query that shows total unique visitors
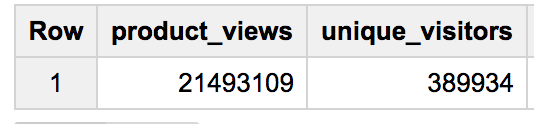
Your query determines the total views by counting product_views and the number of unique visitors by counting fullVisitorID.
- Click "+" (Compose New Query) icon.
- Write this query in the editor:
- To ensure that your syntax is correct, confirm that the real-time query validator shows the Green check icon.
- Click Run. Read the results to view the number of unique visitors.
Results:
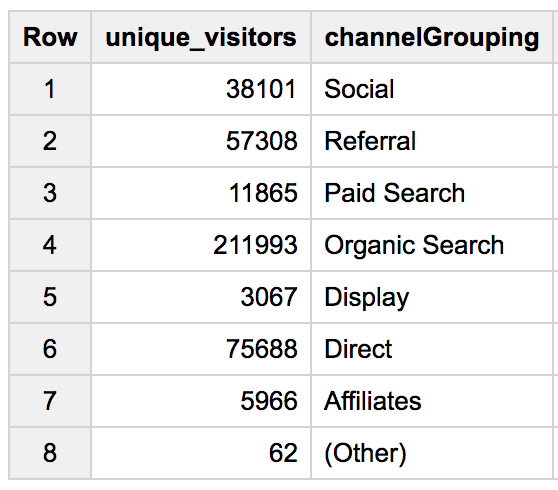
- Now write a query that shows total unique visitors(
fullVisitorID) by the referring site (channelGrouping):
Results:
- Write a query to list all the unique product names (
v2ProductName) alphabetically:
Tip: In SQL, the ORDER BY clauses defaults to Ascending (ASC) A to Z. If you want the reverse, try ORDER BY field_name DESC.
Results:
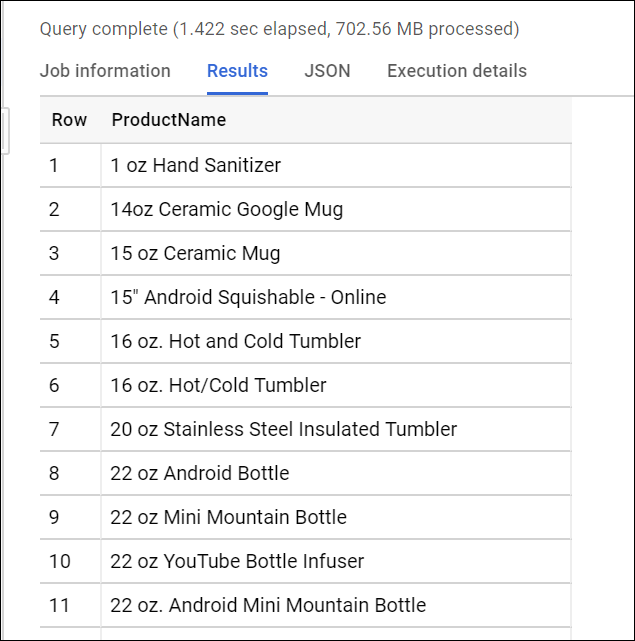
This query returns a total of 633 products (rows).
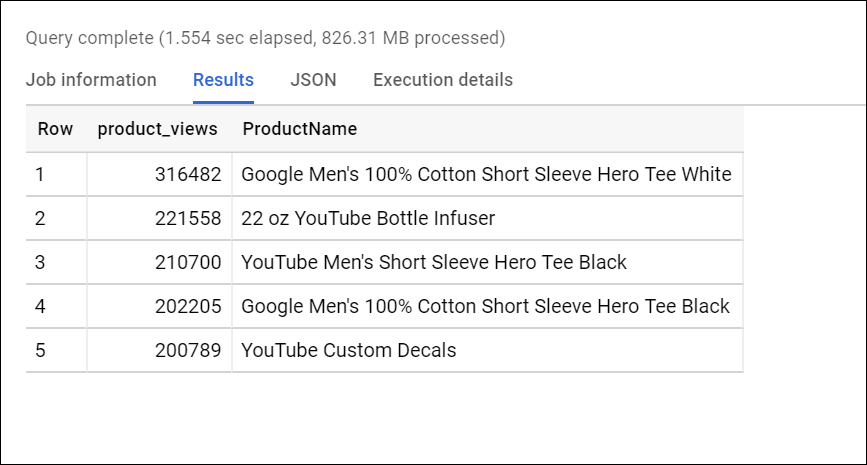
- Write a query to list the five products with the most views (
product_views) from all visitors (including people who have viewed the same product more than once). Your query counts number of times a product (v2ProductName) was viewed (product_views), puts the list in descending order, and lists the top 5 entries:
Tip: In Google Analytics, a visitor can "view" a product during the following interaction types: 'page', 'screenview', 'event', 'transaction', 'item', 'social', 'exception', 'timing'. For our purposes, simply filter for only type = 'PAGE'.
Results:
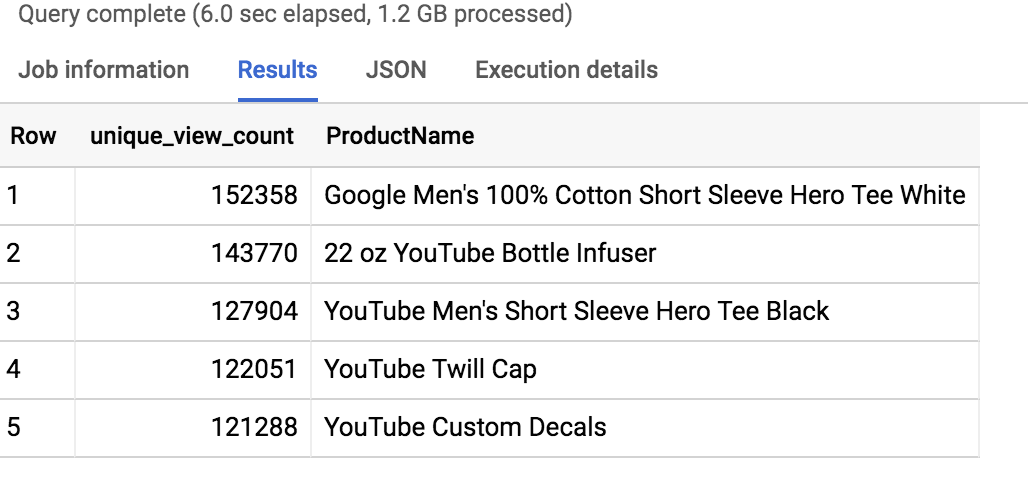
- Bonus: Now refine the query to no longer double-count product views for visitors who have viewed a product many times. Each distinct product view should only count once per visitor:
Tip: You can use the SQL WITH clause to help break apart a complex query into multiple steps. Here we first create a query that finds each unique product per visitor and counts them once. Then the second query performs the aggregation across all visitors and products.
Results:
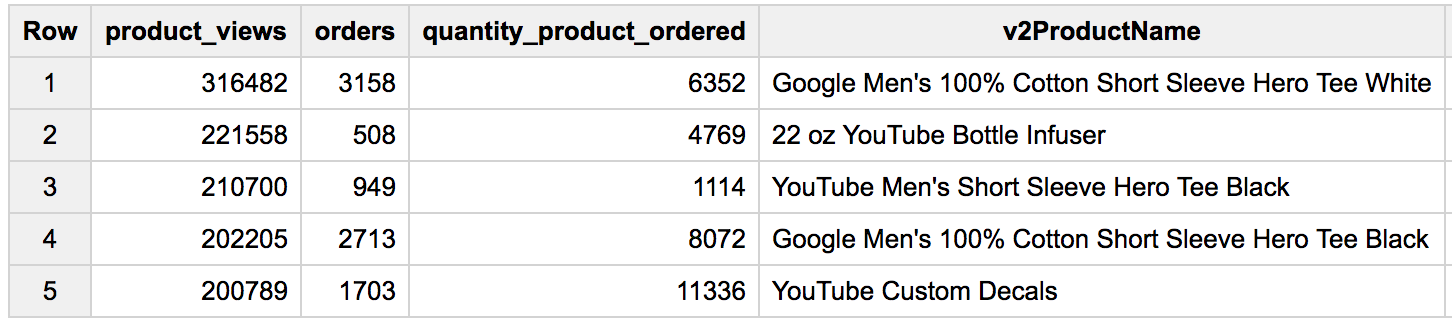
- Next, expand your previous query to include the total number of distinct products ordered and the total number of total units ordered (
productQuantity):
Results:
Questions:
- Expand the query to include the average amount of product per order (total number of units ordered/total number of orders, or
SUM(productQuantity)/COUNT(productQuantity)):
Results
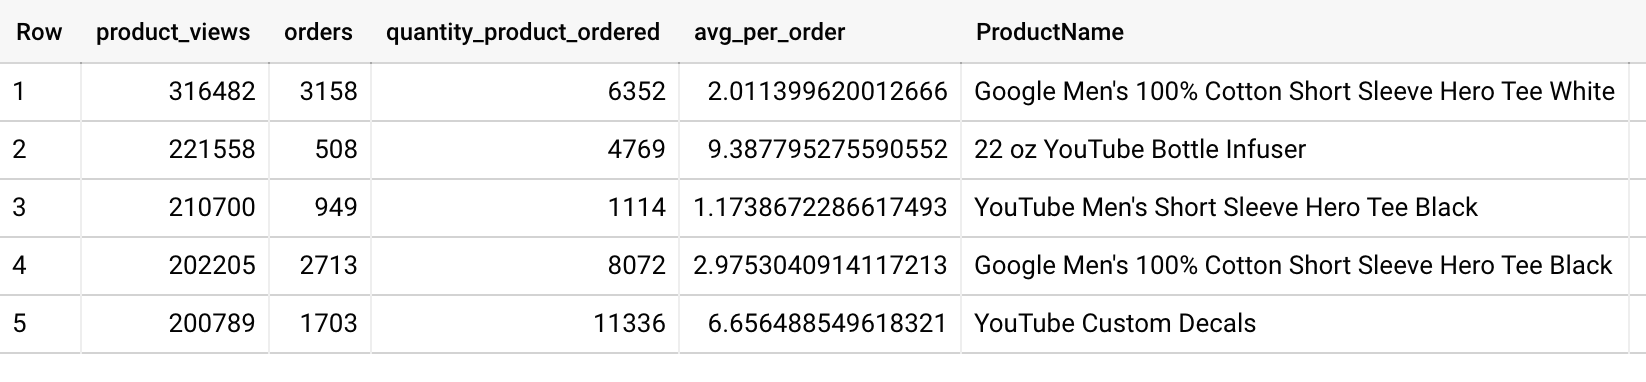
Question:
The 22 oz YouTube Bottle Infuser had the highest avg_per_order with 9.38 units per order.
Click Check my progress to verify the objective.
Congratulations!
Congratulations! In this lab, you used BigQuery to view and query data to gain meaningful insight on various aspects of product marketing. You learned how to access an ecommerce dataset, look at the dataset metadata, remove duplicate entries, and write and execute queries.
Next steps/Learn more
- Explore BigQuery Public Datasets.
- Have a Google Analytics account and want to query your own datasets in BigQuery? Follow this export guide.
- Check out 15 Awesome things you probably didn’t know about BigQuery.
- Check out other labs to learn more about BigQuery:
Google Cloud training and certification
...helps you make the most of Google Cloud technologies. Our classes include technical skills and best practices to help you get up to speed quickly and continue your learning journey. We offer fundamental to advanced level training, with on-demand, live, and virtual options to suit your busy schedule. Certifications help you validate and prove your skill and expertise in Google Cloud technologies.
Manual Last Updated April 02, 2024
Lab Last Tested April 02, 2024
Copyright 2024 Google LLC All rights reserved. Google and the Google logo are trademarks of Google LLC. All other company and product names may be trademarks of the respective companies with which they are associated.