Understanding and Analyzing Your Costs with Google Cloud Billing Reports
GSP614

Overview
Google Cloud cost management tools provide greater visibility, accountability, control, and intelligence so that you can scale your business in the cloud with confidence. Tailored to meet the needs of organizations of all sizes, these tools help reduce complexity and increase the predictability of your cloud costs.
Google Cloud Billing reports is a cost management tool that provides built-in reporting within the console. In this lab, you familiarize yourself with Billing reports and understand how to answer fundamental cost management questions, such as:
In this lab, you learn about Google Cloud Billing Reports, a cost management tool that provides built-in reporting within the Google Cloud console.
Objectives
In this lab you learn how to perform the following tasks:
- Explore Cloud Billing report charts in the Google Cloud console using a sample billing account.
- Analyze cost trends using report filters.
- Explore Cloud Billing cost drivers.
- Review a summary of costs.
Setup and requirements
Before you click the Start Lab button
Read these instructions. Labs are timed and you cannot pause them. The timer, which starts when you click Start Lab, shows how long Google Cloud resources will be made available to you.
This hands-on lab lets you do the lab activities yourself in a real cloud environment, not in a simulation or demo environment. It does so by giving you new, temporary credentials that you use to sign in and access Google Cloud for the duration of the lab.
To complete this lab, you need:
- Access to a standard internet browser (Chrome browser recommended).
- Time to complete the lab---remember, once you start, you cannot pause a lab.
Task 1. Access the sample Cloud Billing account
In this task you access the sample billing report that is used in this lab.
-
To open the billing report for a sample billing account, right click the following link and select Open link in incognito window:
The link opens the Google Cloud console in the Billing Reports window. In the remainder of this lab you will explore the various features of billing.
Task 2. Explore Cloud Billing report charts
In this task you explore your Cloud Billing report chart to see how much you are spending. You have a variety of options available to customize your report views, including filters and other settings. Your report view changes depending on the filter selections you choose.
-
In the Cloud console, in the Billing
menu, click Reports.
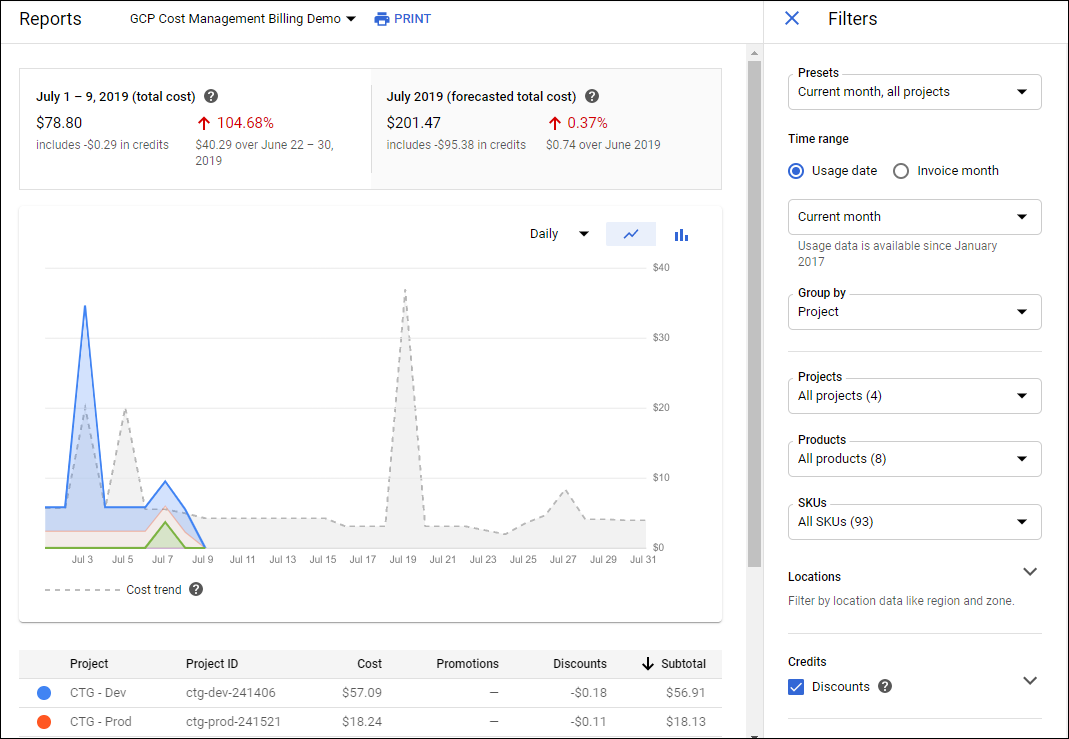
This Reports page includes a chart that plots usage costs for all projects linked to a billing account.
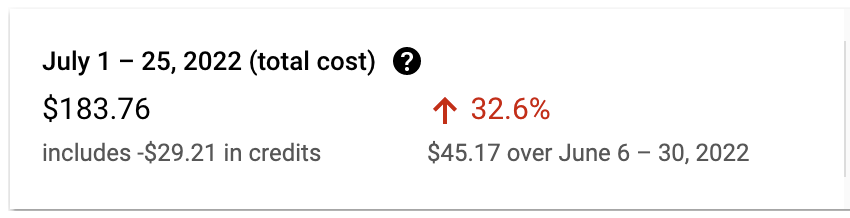
- In the top left, the actual cost to date is displayed for the current month, including a comparison to the cost over the same number of days in the preceding month.
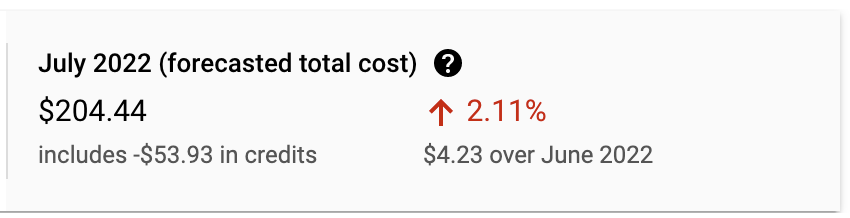
- In the top right, the forecasted total cost is displayed for the current month, including a comparison to the previous month.
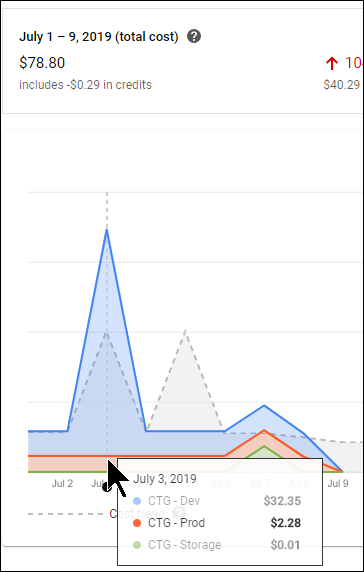
- To visualize your daily costs grouped by project, hold the pointer over a specific day on one of the colors in the chart to compare the cost for that project to the total cost for the day.
- The cost trend line (the dotted line) is visible when your selected time period includes a date in the future.
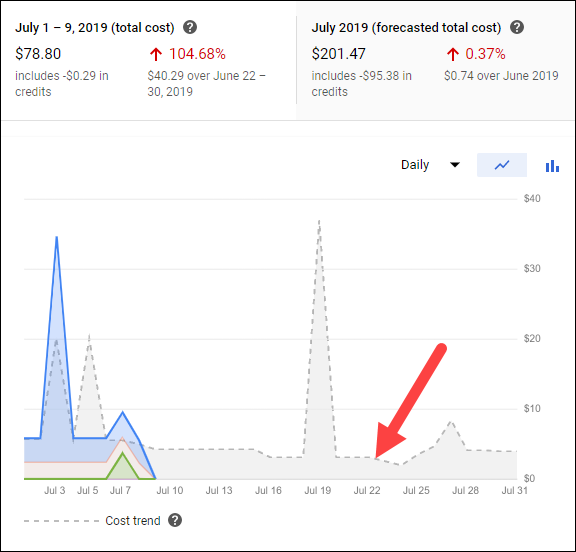
- The cost trend line indicates how much you're forecasted to spend in that time period.
It also reflects both the long term trend and any consistent monthly cycles. Learn more about trends at Viewing your forecasted costs.
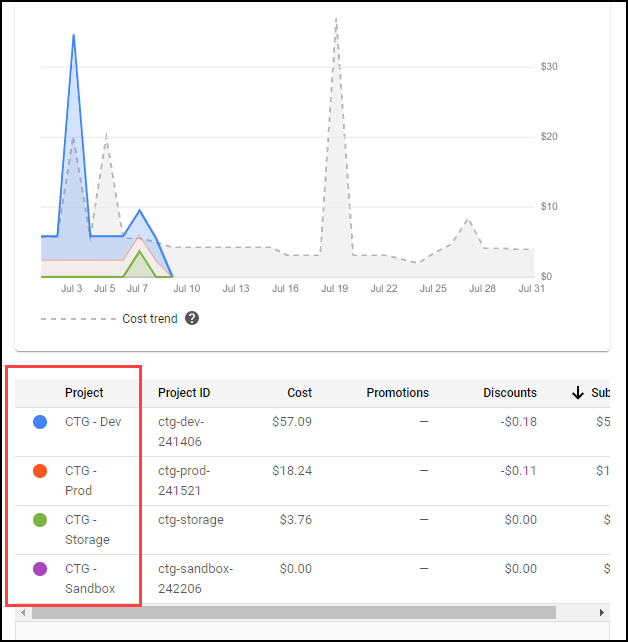
- Below the chart is a summary of the costs by project in the selected time period.
Filters and grouping
Customize your view using the drop-downs for filtering and grouping.
View your charges by invoice and without taxes or adjustments
- Click the expand icon
in the upper right.
-
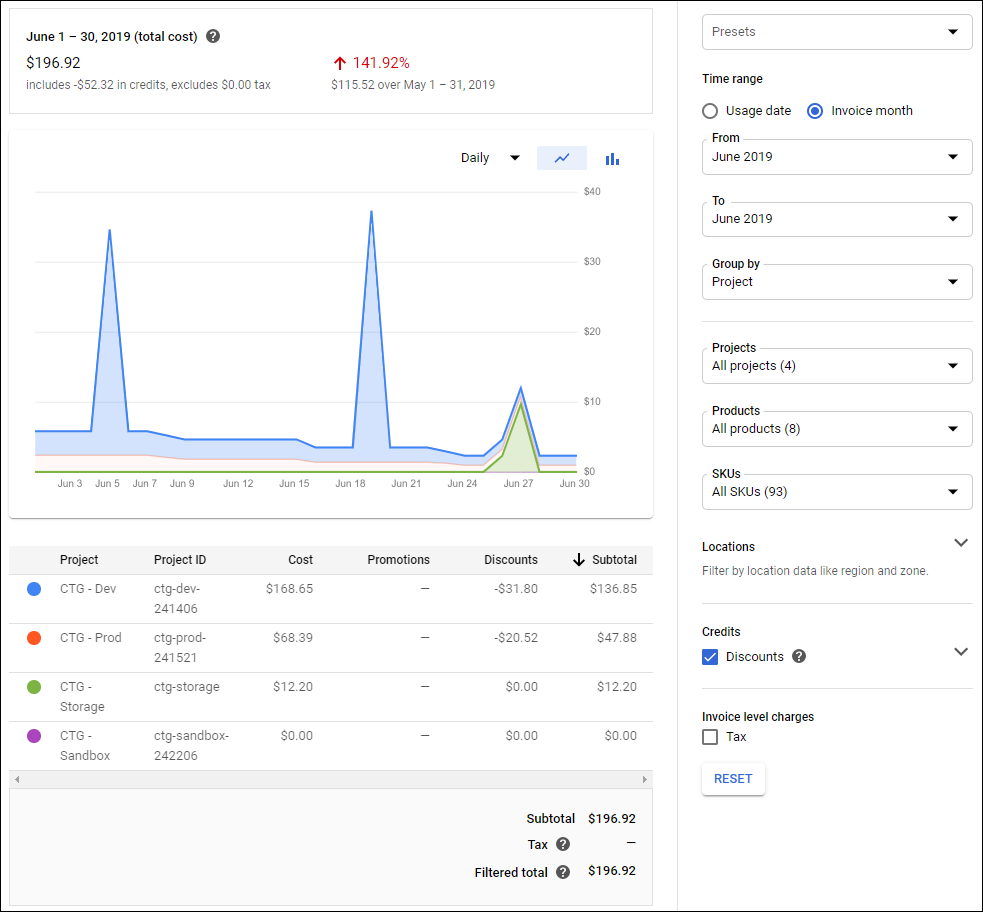
In the Time range section, select Invoice month and set your From and To month range.
-
View the chart. Notice the Reports page updates to match the invoice month and tax option you selected. The table below the chart displays the cost breakdown based on your filter selections.
Task 3. Analyze your cost trends
In this task you analyze your cost trends. You filter the view by time range, location, and credits to see how your costs have changed.
View your cost trend over a specified time period
-
In the Filters pane, for Time range, select Usage date.
-
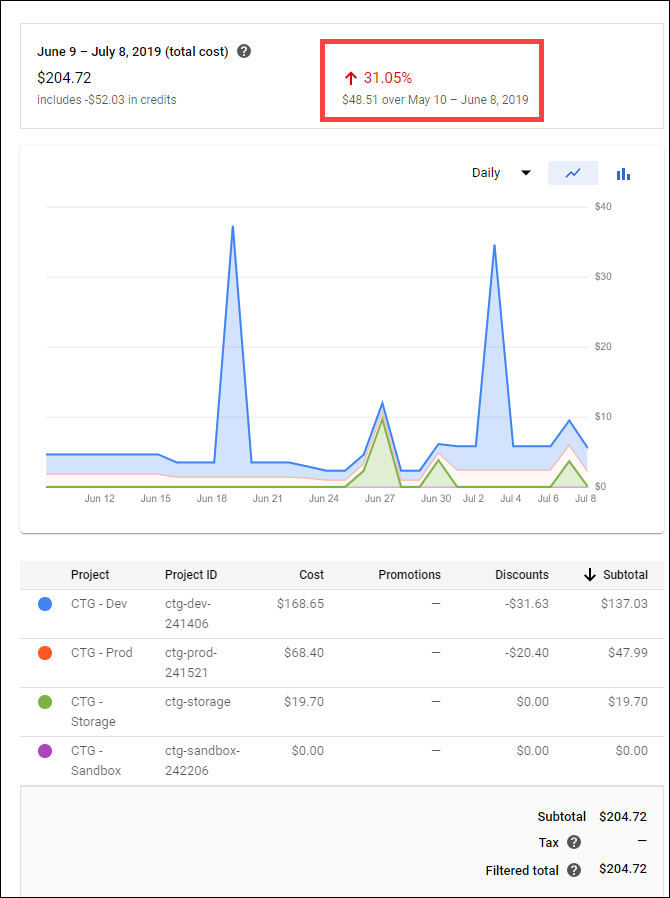
Click Custom range, and then select Last 30 days.
The chart shows the last 30 days of usage. As before, the top of the graph shows your costs compared to the previous time period so you can easily compare how your costs trend over time.
View your cost trend by location
-
In the Filters pane, expand the Locations section.
-
Under Geography, click Americas.
Notice how the specific Americas regions and multi-regions are selected and that the graph changes to reflect this.
-
Under Region & multi-region, click europe-west1.
Notice that the europe-west1 region is added to the graph.
-
Clear the Geography and Region & multi-region options previously selected, and then collapse the Locations group.
View your cost trend by credits
You can use credits filters to change the view of your cost calculations. You can select all applicable credits (default) to be included in the cost calculations, or you can clear some or all of the credit options to exclude credits from the cost calculations.
For more information about credits, see View and analyze your credits.
Sustained use discounts
- Expand the Credits section.
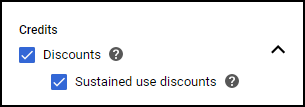
- Clear the Sustained use discounts checkbox.
-
Select the Sustained use discounts checkbox to see how the chart changes.
-
Collapse the Credits section.
Task 4. Explore your cost drivers
In this task you explore your billing reports to visualize and investigate any unexpected changes in cost.
Find the unexpected cost increase
-
Click Reports.
-
In the Filters pane, for Time range, select Invoice month.
-
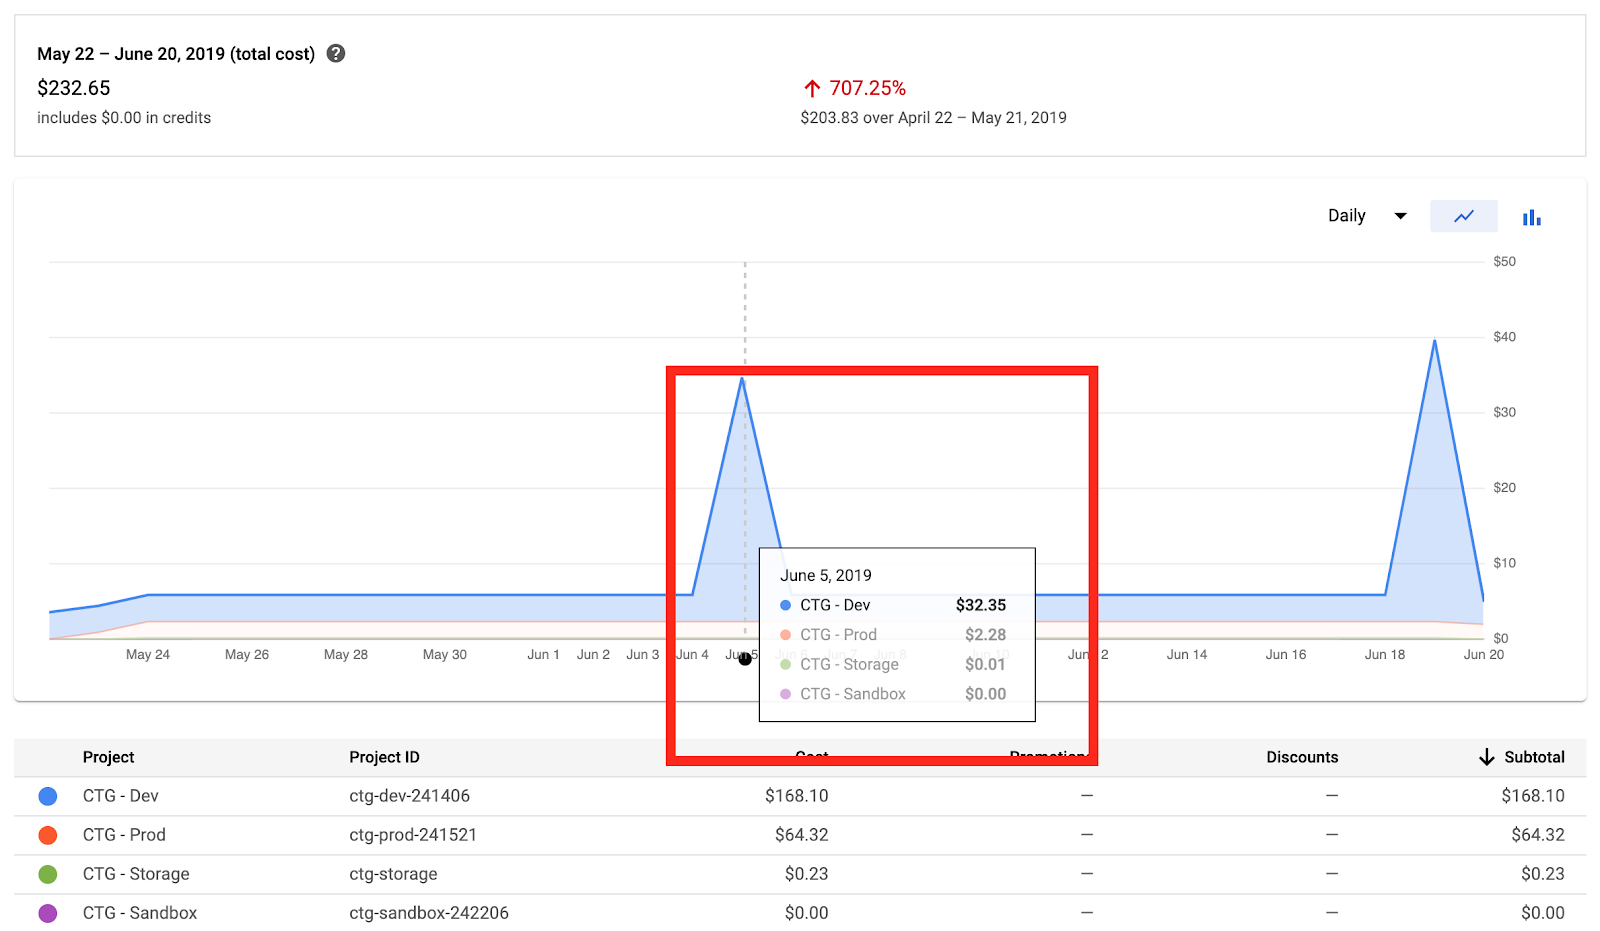
To discover the cause of the large increase in cost, hold the pointer over the spike in the chart to identify the project.
In this case the project causing the large cost increase is CTG-Dev.
-
In the Filters pane, for Projects, click CTG-Dev.
-
In Group by, click Service.
-
To find out which service caused the increase in cost, hold the pointer over the spike in the graph.
In this case it appears that BigQuery caused the increase in cost.
-
In the Filters pane, for Group by, click SKU.
In this case, the BigQuery Analysis SKU was the highest cost on this day. This SKU is charged when executing queries using BigQuery.
Task 5. Review a summary of your costs
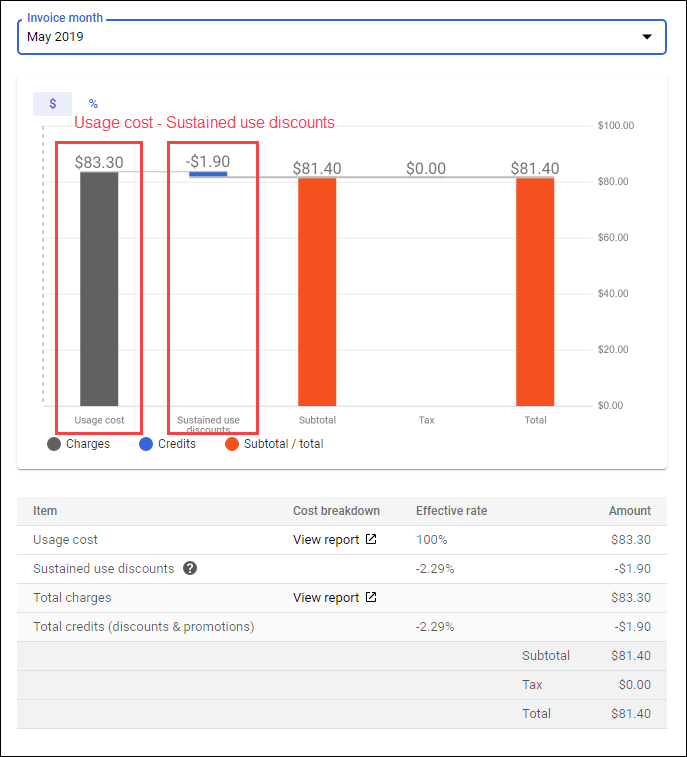
In this task you review a summary of your costs. Billing reports show current cost trends and forecasted costs. The cost breakdown report shows what you would have spent at the on-demand price for your Google Cloud usage, and how your final invoice amount was affected by any credits, adjustments, and taxes.
- In the Cloud console, in the Billing
The graph shows your total costs for a specific invoice month and how credits and taxes affected the final amount invoiced for that month. For example, sustained use discounts automatically apply to Compute Engine resources that run a significant portion of the billing month, helping save you money. The sample chart below shows the total cost of usage minus the credits applied for sustained use discounts.
To learn more see, Committed use discounts and sustained use discounts.
Congratulations!
You learned how to use Google Cloud Billing reports and the cost breakdown report to gain visibility into your current and forecasted costs.
Finish your Quest
This self-paced lab is part of the Understanding Your Google Cloud Costs quest. A quest is a series of related labs that form a learning path. Completing this quest earns you the badge above, to recognize your achievement. You can make your badge (or badges) public and link to them in your online resume or social media account. Enroll in this quest and get immediate completion credit if you've taken this lab. See other available Quests.
Take your next lab
Take another lab in the Understanding Your Google Cloud Costs Quest:
Next steps / learn more
- Documentation: View Your Billing Reports and Cost Trends
- Documentation: Understand Your Savings with Cost Breakdown Reports
- Videos: Billing & Cost Management
- Webpage: Cost Management
Google Cloud training and certification
...helps you make the most of Google Cloud technologies. Our classes include technical skills and best practices to help you get up to speed quickly and continue your learning journey. We offer fundamental to advanced level training, with on-demand, live, and virtual options to suit your busy schedule. Certifications help you validate and prove your skill and expertise in Google Cloud technologies.
Manual Last Updated February 15, 2023
Lab Last Tested February 15, 2023
Copyright 2024 Google LLC All rights reserved. Google and the Google logo are trademarks of Google LLC. All other company and product names may be trademarks of the respective companies with which they are associated.