チェックポイント
Generate account activity
/ 20
Export the audit logs
/ 20
Generate more account activity
/ 25
Use BigQuery to analyze the audit logs
/ 35
Analyze audit logs using BigQuery
 IMPORTANT:
 Make sure to complete this hands-on lab on a desktop/laptop only.
 There are only 5 attempts permitted per lab.
 As a reminder – it is common to not get every question correct on your first try, and even to need to redo a task; this is part of the learning process.
 Once a lab is started, the timer cannot be paused. After 1 hour and 30 minutes, the lab will end and you’ll need to start again.
 For more information review the Lab technical tips reading.
Activity overview
Google Cloud services write audit logs that record administrative activities and access within your Google Cloud resources. Audit log entries help you answer the questions "who did what, where, and when" within your Google Cloud projects. Enabling audit logs helps your security, auditing, and compliance entities monitor Google Cloud data and systems for possible vulnerabilities or external data misuse.
In this lab, you'll investigate audit logs to identify patterns of suspicious activity involving cloud resources.
Scenario
Cymbal Bank has officially migrated to its hybrid cloud solution and successfully deployed its workflows on the new cloud environment. Unfortunately, the Security Engineering team has been notified of a high severity alert involving unauthorized access to several of its cloud resources. This is alarming since malicious actors can use compromised cloud resources to exfiltrate data and launch attacks on other systems. It is your first time experiencing a security incident. Your team lead, Chloe, recognizes this as a valuable opportunity for you to learn the processes and procedures involved with incident response. You've been assigned to shadow and observe Hannah, an incident responder on the Incident Response Team which is a unit of the Security Engineering department. Hannah has provided you with access to the alert's logs which you'll use to investigate the malicious activity. You want to get a better understanding of the security incident so you have set up a test environment to recreate the incident and analyze the artifacts. You will use two separate user accounts: one account will generate the malicious activity, and the other account will be used to investigate the activity.
Here's how you'll do this task. First, you'll recreate the security incident by generating activity from the first user account. Next, you'll export the logs for further analysis. Then, you'll continue recreating the incident and generate additional user activity. Finally, you'll utilize BigQuery to analyze the logs.
Setup
Before you click Start Lab
Read these instructions. Labs are timed and you cannot pause them. The timer, which starts when you click Start Lab, shows how long Google Cloud resources will be made available to you.
This practical lab lets you do the activities yourself in a real cloud environment, not in a simulation or demo environment. It does so by giving you new, temporary credentials that you use to sign in and access Google Cloud for the duration of the lab.
To complete this lab, you need:
- Access to a standard internet browser (Chrome browser recommended).
- Time to complete the lab---remember, once you start, you cannot pause a lab.
How to start your lab and sign in to the Google Cloud console
-
Click the Start Lab button. On the left is the Lab Details panel with the following:
- Time remaining
- The Open Google Cloud console button
- The temporary credentials that you must use for this lab
- Other information, if needed, to step through this lab
Note: If you need to pay for the lab, a pop-up opens for you to select your payment method. -
Click Open Google Cloud console (or right-click and select Open Link in Incognito Window) if you are running the Chrome browser. The Sign in page opens in a new browser tab.
Tip: You can arrange the tabs in separate, side-by-side windows to easily switch between them.
Note: If the Choose an account dialog displays, click Use Another Account. -
If necessary, copy the Google Cloud username below and paste it into the Sign in dialog. Click Next.
You can also find the Google Cloud username in the Lab Details panel.
- Copy the Google Cloud password below and paste it into the Welcome dialog. Click Next.
You can also find the Google Cloud password in the Lab Details panel.
- Click through the subsequent pages:
- Accept the terms and conditions
- Do not add recovery options or two-factor authentication (because this is a temporary account)
- Do not sign up for free trials
After a few moments, the Console opens in this tab.

Activate Cloud Shell
Cloud Shell is an online development and operations environment accessible anywhere with your browser. Cloud Shell provides command-line access to your Google Cloud resources.
- Click Activate Cloud Shell (
) at the top right of the Google Cloud console. You may be asked to click Continue.
After Cloud Shell starts up, you'll see a message displaying your Google Cloud Project ID for this session:
The command-line tool for Google Cloud, gcloud,comes pre-installed on Cloud Shell and supports tab-completion. In order to access Google Cloud, you'll have to first authorize gcloud.
- List the active account name with this command:
-
A pop-up will appear asking you to Authorize Cloud Shell. Click Authorize.
-
Your output should now look like this:
Output:
- List the project ID with this command:
Example output:
Task 1. Generate account activity
In this task, you'll create and delete cloud resources to generate account activity which you'll access as Cloud Audit Logs.
- Copy the following commands into the Cloud Shell terminal:
- Press ENTER.
Click Check my progress to verify that you have completed this task correctly.
Task 2. Export the audit logs
The activity you generated in the previous task was recorded as audit logs. In this task you'll export these logs to a BigQuery dataset for further analysis.
- In the Google Cloud console, in the Navigation menu (
) click Logging > Logs Explorer. The Logs Explorer page opens. (You may need to click More Products to expand the Navigation menu options and locate Logging under Operations.)
- When exporting logs, the current filter will be applied to what is exported. Copy the following query into the Query builder:
- Click Run query. The query results should display on the Query results pane. This query filters for Cloud Audit logs within your project.
- Under the Query editor field, click More actions > Create sink. The Create logs routing sink dialog opens.
- In the Create logs routing sink dialog, specify the following settings and leave all other settings at their defaults:
| Section | Field: values |
|---|---|
| Sink details | Sink name: AuditLogsExport Click Next. |
| Sink destination |
Select sink service: BigQuery dataset Select BigQuery dataset: Create new BigQuery dataset. The Create dataset dialog opens. |
| Create dataset |
Dataset ID: auditlogs_dataset Click Create Dataset. The Create dataset dialog closes, and you'll return to the Sink destination dialog. |
| Sink destination | Click Next. Uncheck the Use Partitioned Tables checkbox, if it is already selected, and click Next. |
| Choose logs to include in sink | Notice the pre-filled Build inclusion filter:logName=("projects/[PROJECT ID]/logs/cloudaudit.googleapis.com%2Factivity") Click Next. Click Create Sink. Return to the Logs Explorer page. |
- In the Logging navigation pane, click Log Router to view the AuditLogsExport sink in the Log Router Sinks list.
- Inline with the AuditLogsExport sink, click More actions (
) > View sink details to view information about the AuditLogsExport sink you created. The Sink details dialog opens.
- Click Cancel to close the Sink details dialog when you're done viewing the sink information.
All future logs will now be exported to BigQuery, and the BigQuery tools can be used to perform analysis on the audit log data. The export does not export existing log entries.
Click Check my progress to verify that you have completed this task correctly.
Task 3. Generate more account activity
In this task, you'll create and delete cloud resources to generate additional account activity which you'll then access in BigQuery to extract additional insights from the logs.
- Copy the following commands into the Cloud Shell terminal:
These commands generate more activity to view in the audit logs exported to BigQuery.
- Press ENTER.
When prompted, enter Y, and press ENTER. Notice you created two buckets and deleted a Compute Engine instance.
- When the prompt appears after a few minutes, continue by entering the following commands into the Cloud Shell terminal:
- Press ENTER.
Notice you deleted both buckets.
Click Check my progress to verify that you have completed this task correctly.
Task 4. Sign in as the second user
You'll need to switch Google Cloud accounts by logging into the Google Cloud console using the second user account provided in the Lab Details panel. You will use this user account to analyze the logs.
- In the Google Cloud console, click on the user icon in the top-right corner of the screen, and then click Add account.
- Navigate back to the Lab Details panel, copy the Google Cloud username 2:
and password. Then, paste the username and password into the Google Cloud console Sign in dialog.
Task 5. Analyze the Admin Activity logs
In this task, you'll review the Admin activity logs generated in the previous task. Your goal is to identify and apply filters to isolate logs that may indicate suspicious activity. This will enable you to export this subset of logs and streamline the process of analyzing them for potential issues.
Admin Activity logs record the log entries for API calls or other administrative actions that modify the configuration or metadata of resources. For example, the logs record when VM instances and App Engine applications are created when permissions are changed.
- In the Google Cloud console, click the Navigation menu (
- Select Logging > Logs Explorer. The Logs Explorer page opens. (You may need to expand the More Products drop-down menu within the Navigation menu and locate Logging under Operations.)
- Ensure that the Show query toggle button is activated. This opens the Query builder field.
- Copy and paste the following command into the Query builder field. Notice your Google Cloud project ID, project ID in the command.
- Click Run query.
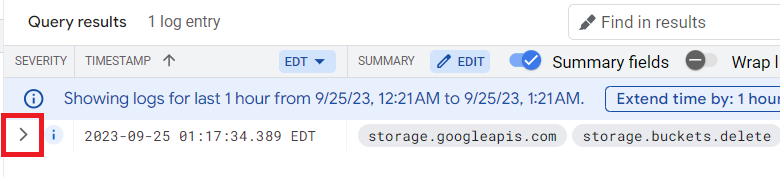
- In the Query results, locate the log entry indicating that a Cloud Storage bucket was deleted, it will contain the storage.buckets.delete summary field. Summary fields are included in the log results to highlight important information about the log entry.
This entry refers to storage.googleapis.com, which calls the storage.buckets.delete method to delete a bucket. The bucket name is the same name as your project id:
- Within this entry, click on the storage.googleapis.com text, and select Show matching entries. The Query results should now display only six entries related to created and deleted cloud storage buckets.
- In the Query editor field, notice the protoPayload.serviceName="storage.googleapis.com" line was added to the query builder, this filters your query to entries only matching storage.googleapis.com.
- Within those query results, click storage.buckets.delete in one of the entries, and select Show matching entries.
Notice another line was added to the Query builder text:
The Query results should now display all entries related to deleted Cloud Storage buckets. You can use this technique to easily locate specific events.
- In the Query results, expand a storage.buckets.delete event by clicking the expand arrow > next to the line:
- Expand the authenticatitonInfo field by clicking the expand arrow > next to the line:
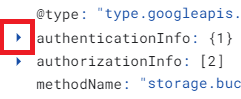
Notice the principalEmail field which displays the email address of the user account that performed this action which is the user 1 account you used to generate the user activity.
Task 6. Use BigQuery to analyze the audit logs
You've generated and exported logs to a BigQuery dataset. In this task, you'll analyze the logs using the Query editor.
- In the Google Cloud console, click the Navigation menu (
- Click BigQuery.
- In the Explorer pane, click the expand arrow beside your project,
. The auditlogs_dataset dataset is displayed.
Next, verify that the BigQuery dataset has appropriate permissions to allow the export writer to store log entries.
-
Click the auditlogs_dataset dataset.
-
In the auditlogs_dataset toolbar, click the Sharing dropdown menu, and select Permissions.
-
On the Share permission for "auditlogs_dataset" page, expand the BigQuery Data Editor section.
-
Confirm that the service account used for log exports is a listed permission. The service account is similar to: service-xxxxxxxx@gcp-sa-logging.iam.gserviceaccount.com
This permission is assigned automatically when log exports are configured so this is a useful way to check that log exports have been configured.
-
Click Close to close the Share Dataset window.
-
In the Explorer pane, click the expander arrow next to the auditlogs_dataset dataset to view the cloudaudit_googleapis_com_acitivty table. This table contains your exported logs.
-
Select the cloudaudit_googleapis_com_acitivty table. The table schema displays. Take a moment to review the table schema and details.
-
Expand the Query drop-down menu and select In new tab.
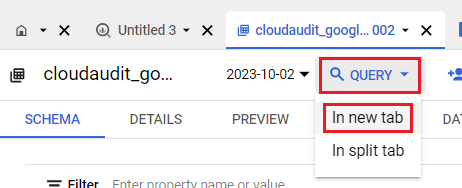
- In the Untitled tab of the query builder, delete any existing text and copy and paste the following command:
This query returns the users that deleted virtual machines in the last 7 days.
- Click Run.
After a couple of seconds, BigQuery will return each time a user deleted a Compute Engine virtual machine within the past 7 days. You should notice one entry, which is the activity you generated in the previous tasks as user 1. Remember, BigQuery shows only the activity that occurred after you created the export.
- Replace the previous query in the Untitled tab with the following:
This query returns the users that deleted Cloud Storage buckets in the last 7 days. You should notice two entries, which is the activity you generated in the previous tasks as user 1.
- Click Run.
The ability to analyze audit logs in BigQuery is very powerful. In this activity, you viewed just two examples of querying audit logs.
Click Check my progress to verify that you have completed this task correctly.
Conclusion
Great work! You have successfully queried in Logs Explorer. You then exported logs and created a dataset that you analyzed in BigQuery.
You have shown how you can use audit logs and filter for types of malicious activity and then further analyze those logs in BigQuery as a way to analyze the threats.
End your lab
Before you end the lab, make sure you’re satisfied that you’ve completed all the tasks. When you're ready, click End Lab and then click Submit.
Ending the lab will remove your access to the lab environment, and you won’t be able to access the work you've completed in it again.
Copyright 2024 Google LLC All rights reserved. Google and the Google logo are trademarks of Google LLC. All other company and product names may be trademarks of the respective companies with which they are associated.